Threatened indigenous territories
Territorial integrity and threats to brazilian indigenous tribes
Indigenous territories, or ITs, was regulated by technical and legal means under the 1988 Constitution. Indigenous tribes are scattered throughout the country, but mainly concentrated in the Northern region. The constant decline of tribes is worrying. There is a noticeable flaw in enforcement, allowing environmental crimes to recur, allowing for hunting, fishing and illegal collection, for example. Not only indigenous people emphasize crimes, but also local scientists and organizations that respect and preserve the territory.
The purpose of this research was to elucidate what is intrinsic and that unfortunately has become common to indigenous territories. Their threats that are constant and fade the legally imposed territorial boundaries.
Creation process
In February 2019, Terra + was launched, an ISA indicator system that allows the analysis of lands encompassed in the Legal Amazon. According to this and other Inpe (Instituto Nacional de Pesquisas Espaciais) data series, I promoted a visualization that separates the 100 territories that are threatened according to six risk categories.
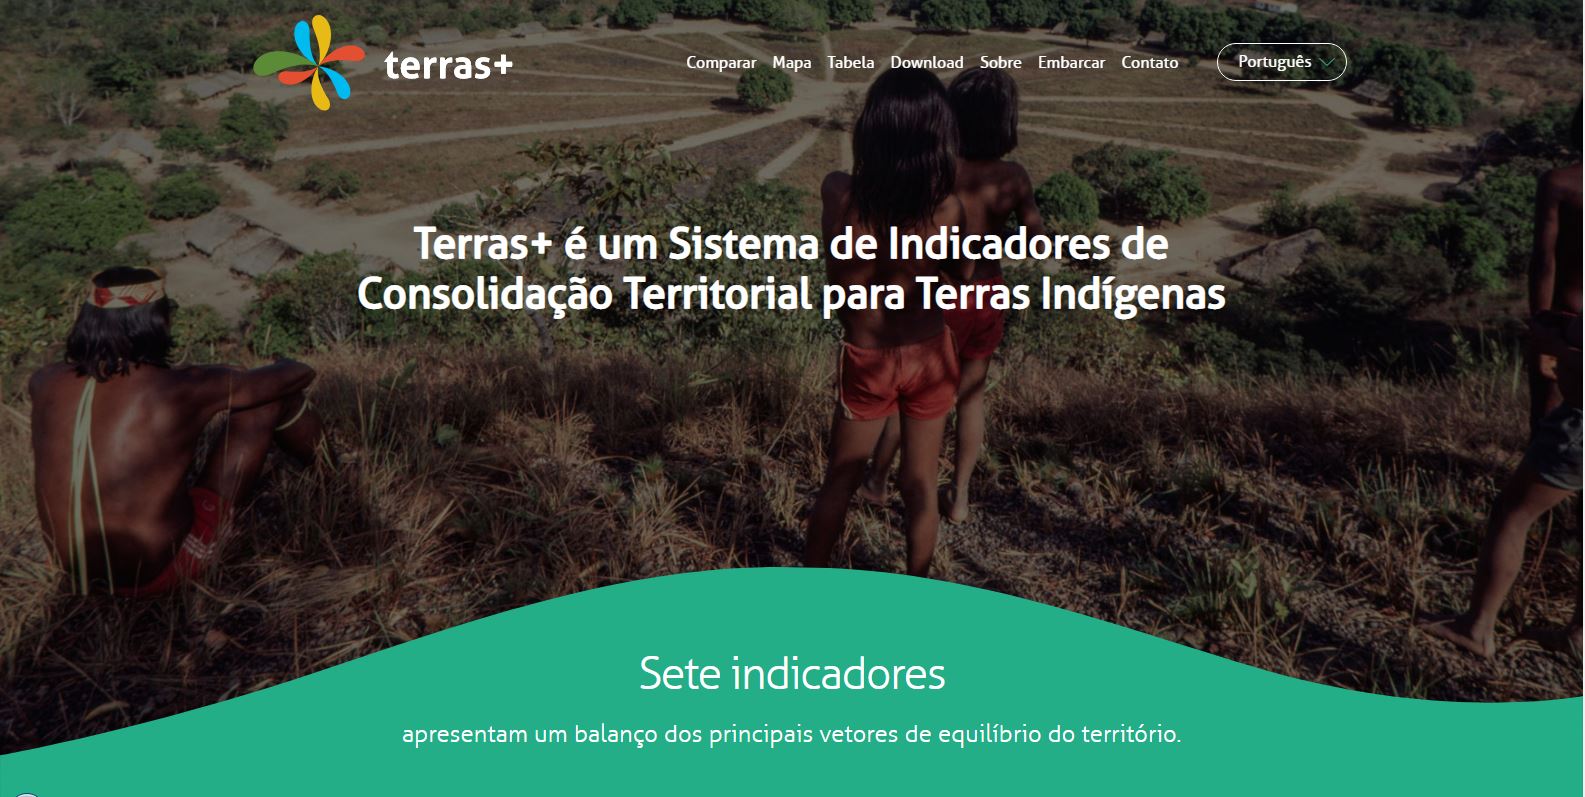
Each IT scores from 0 to 1, similar to the Human Development Index (HDI) and is separated into seven vectors important for land integrity. Each indicator has its grade and the territory can be compared systematically. Therefore, I opted for the territorial integrity vector, which is subdivided into six threats within itself: illegal collection, illegal hunting, illegal fishing, mining, logging and land invasion.
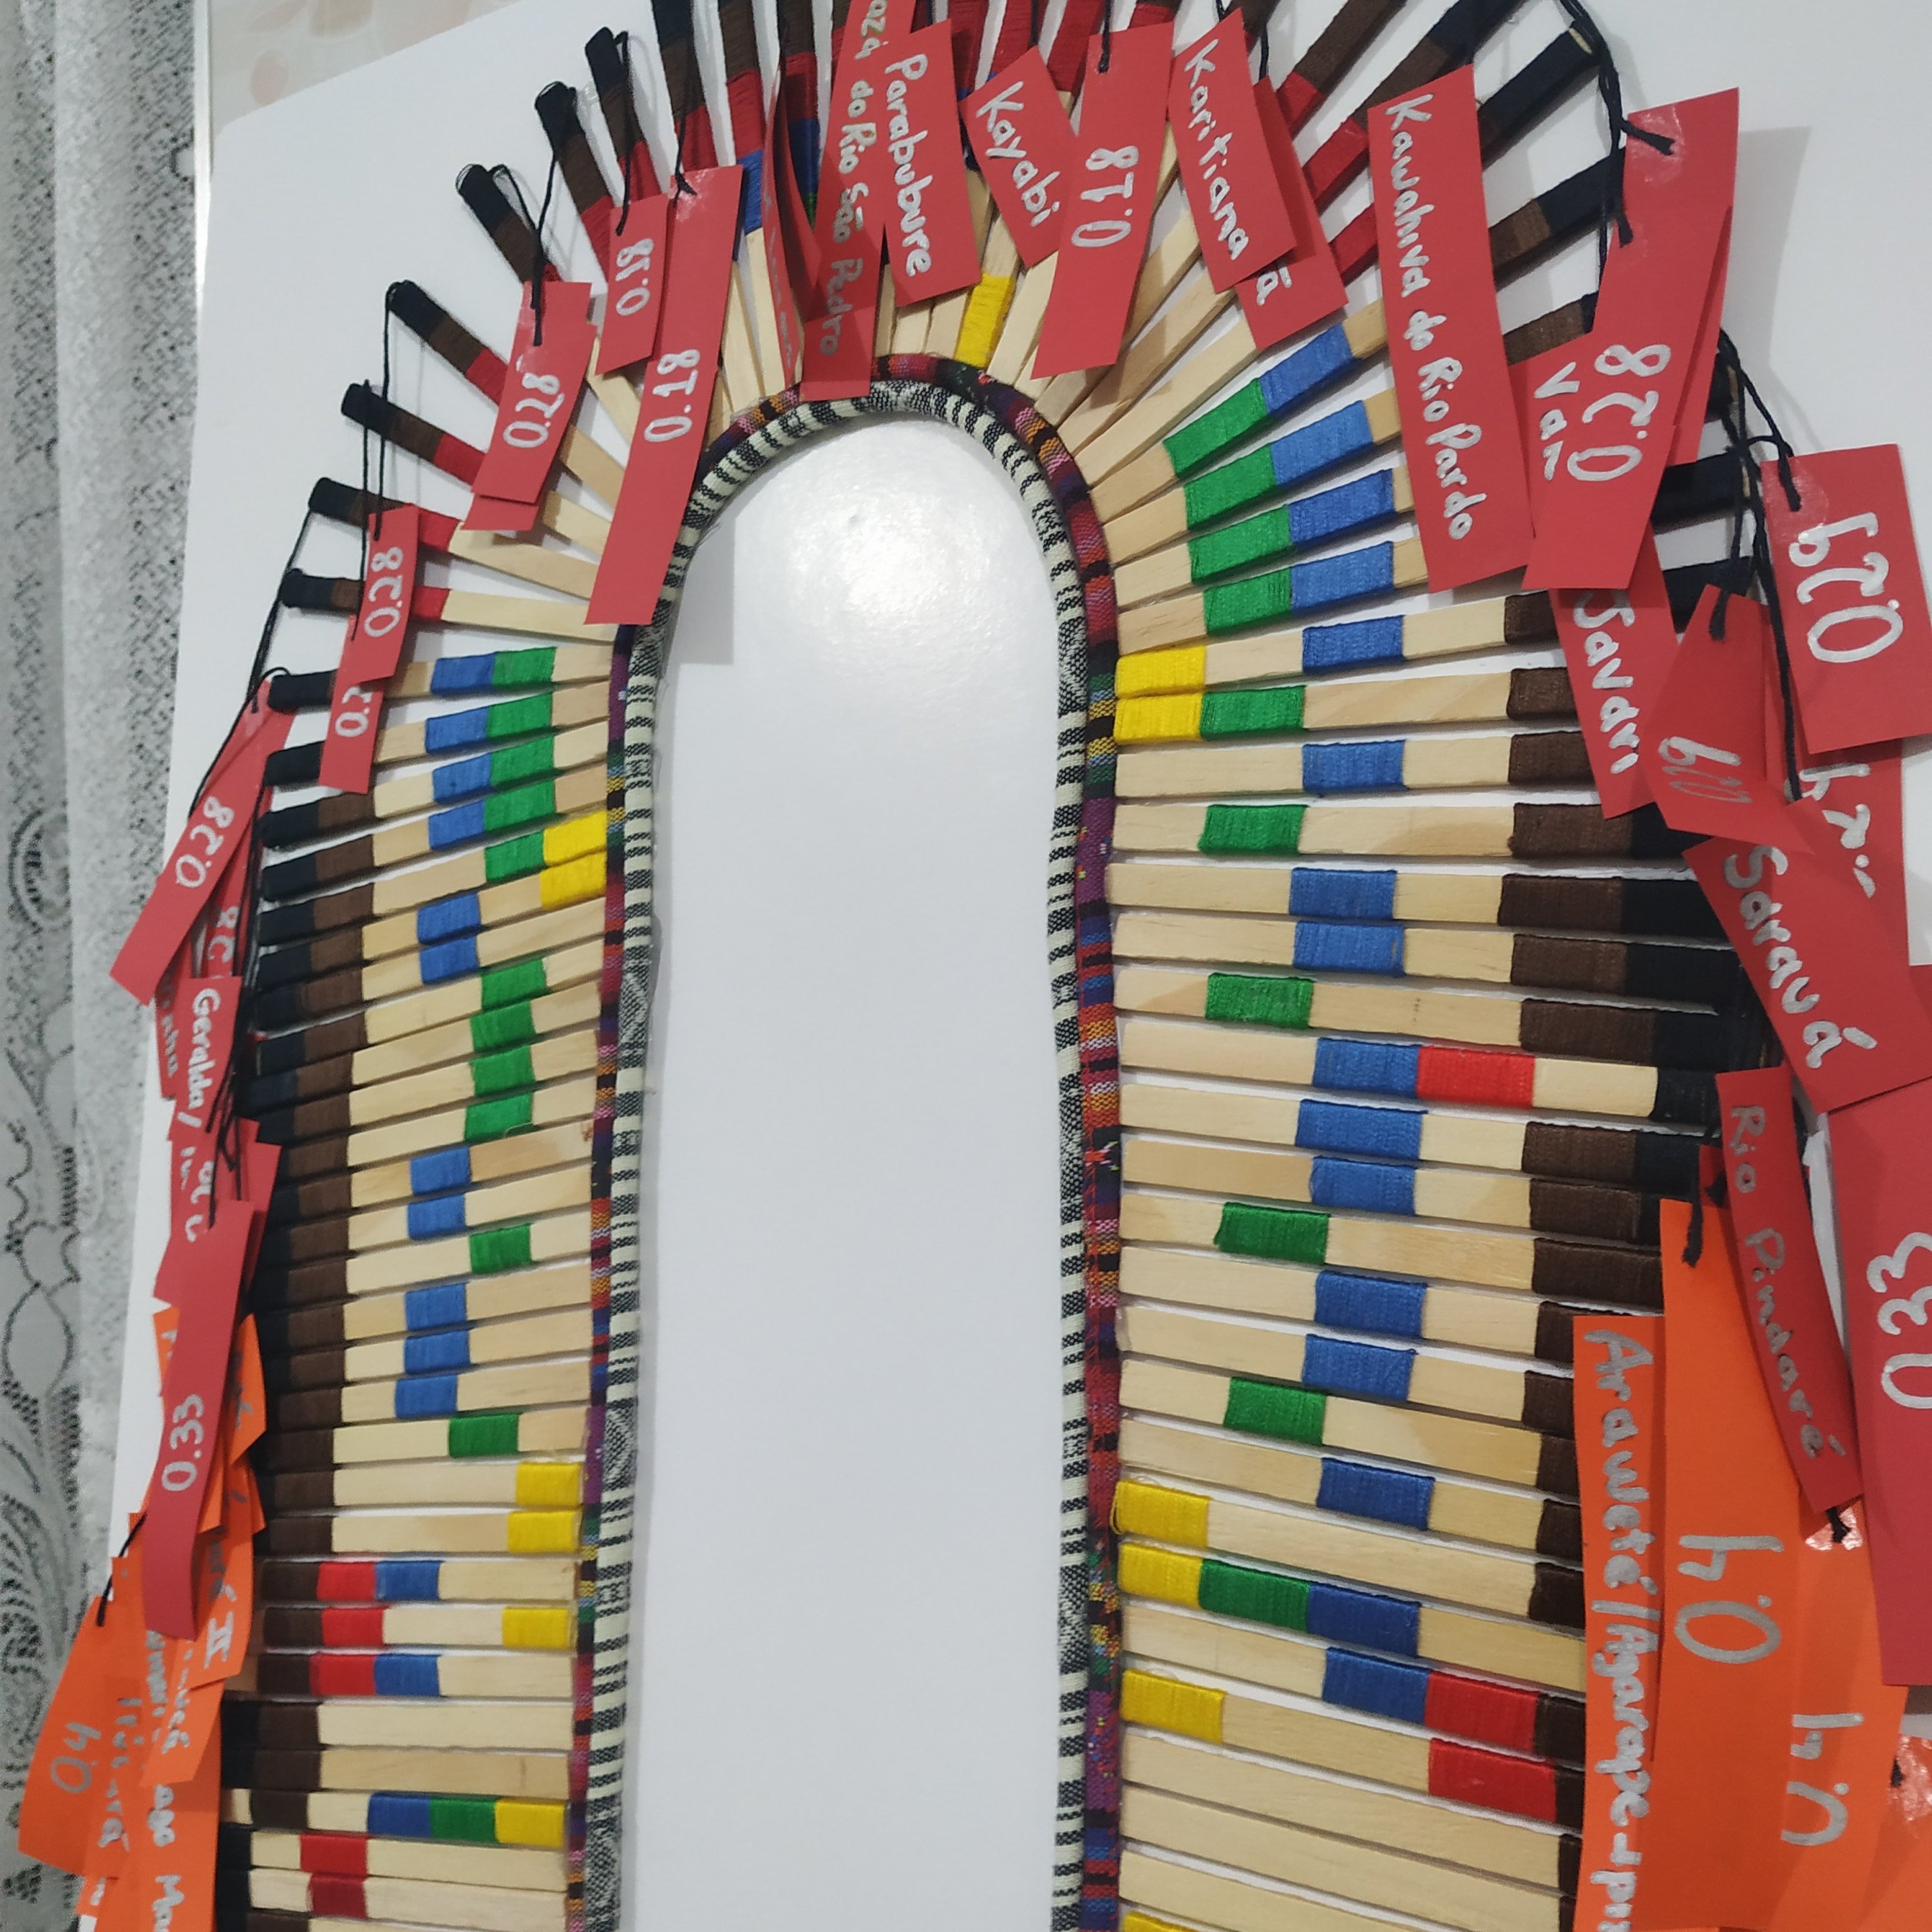
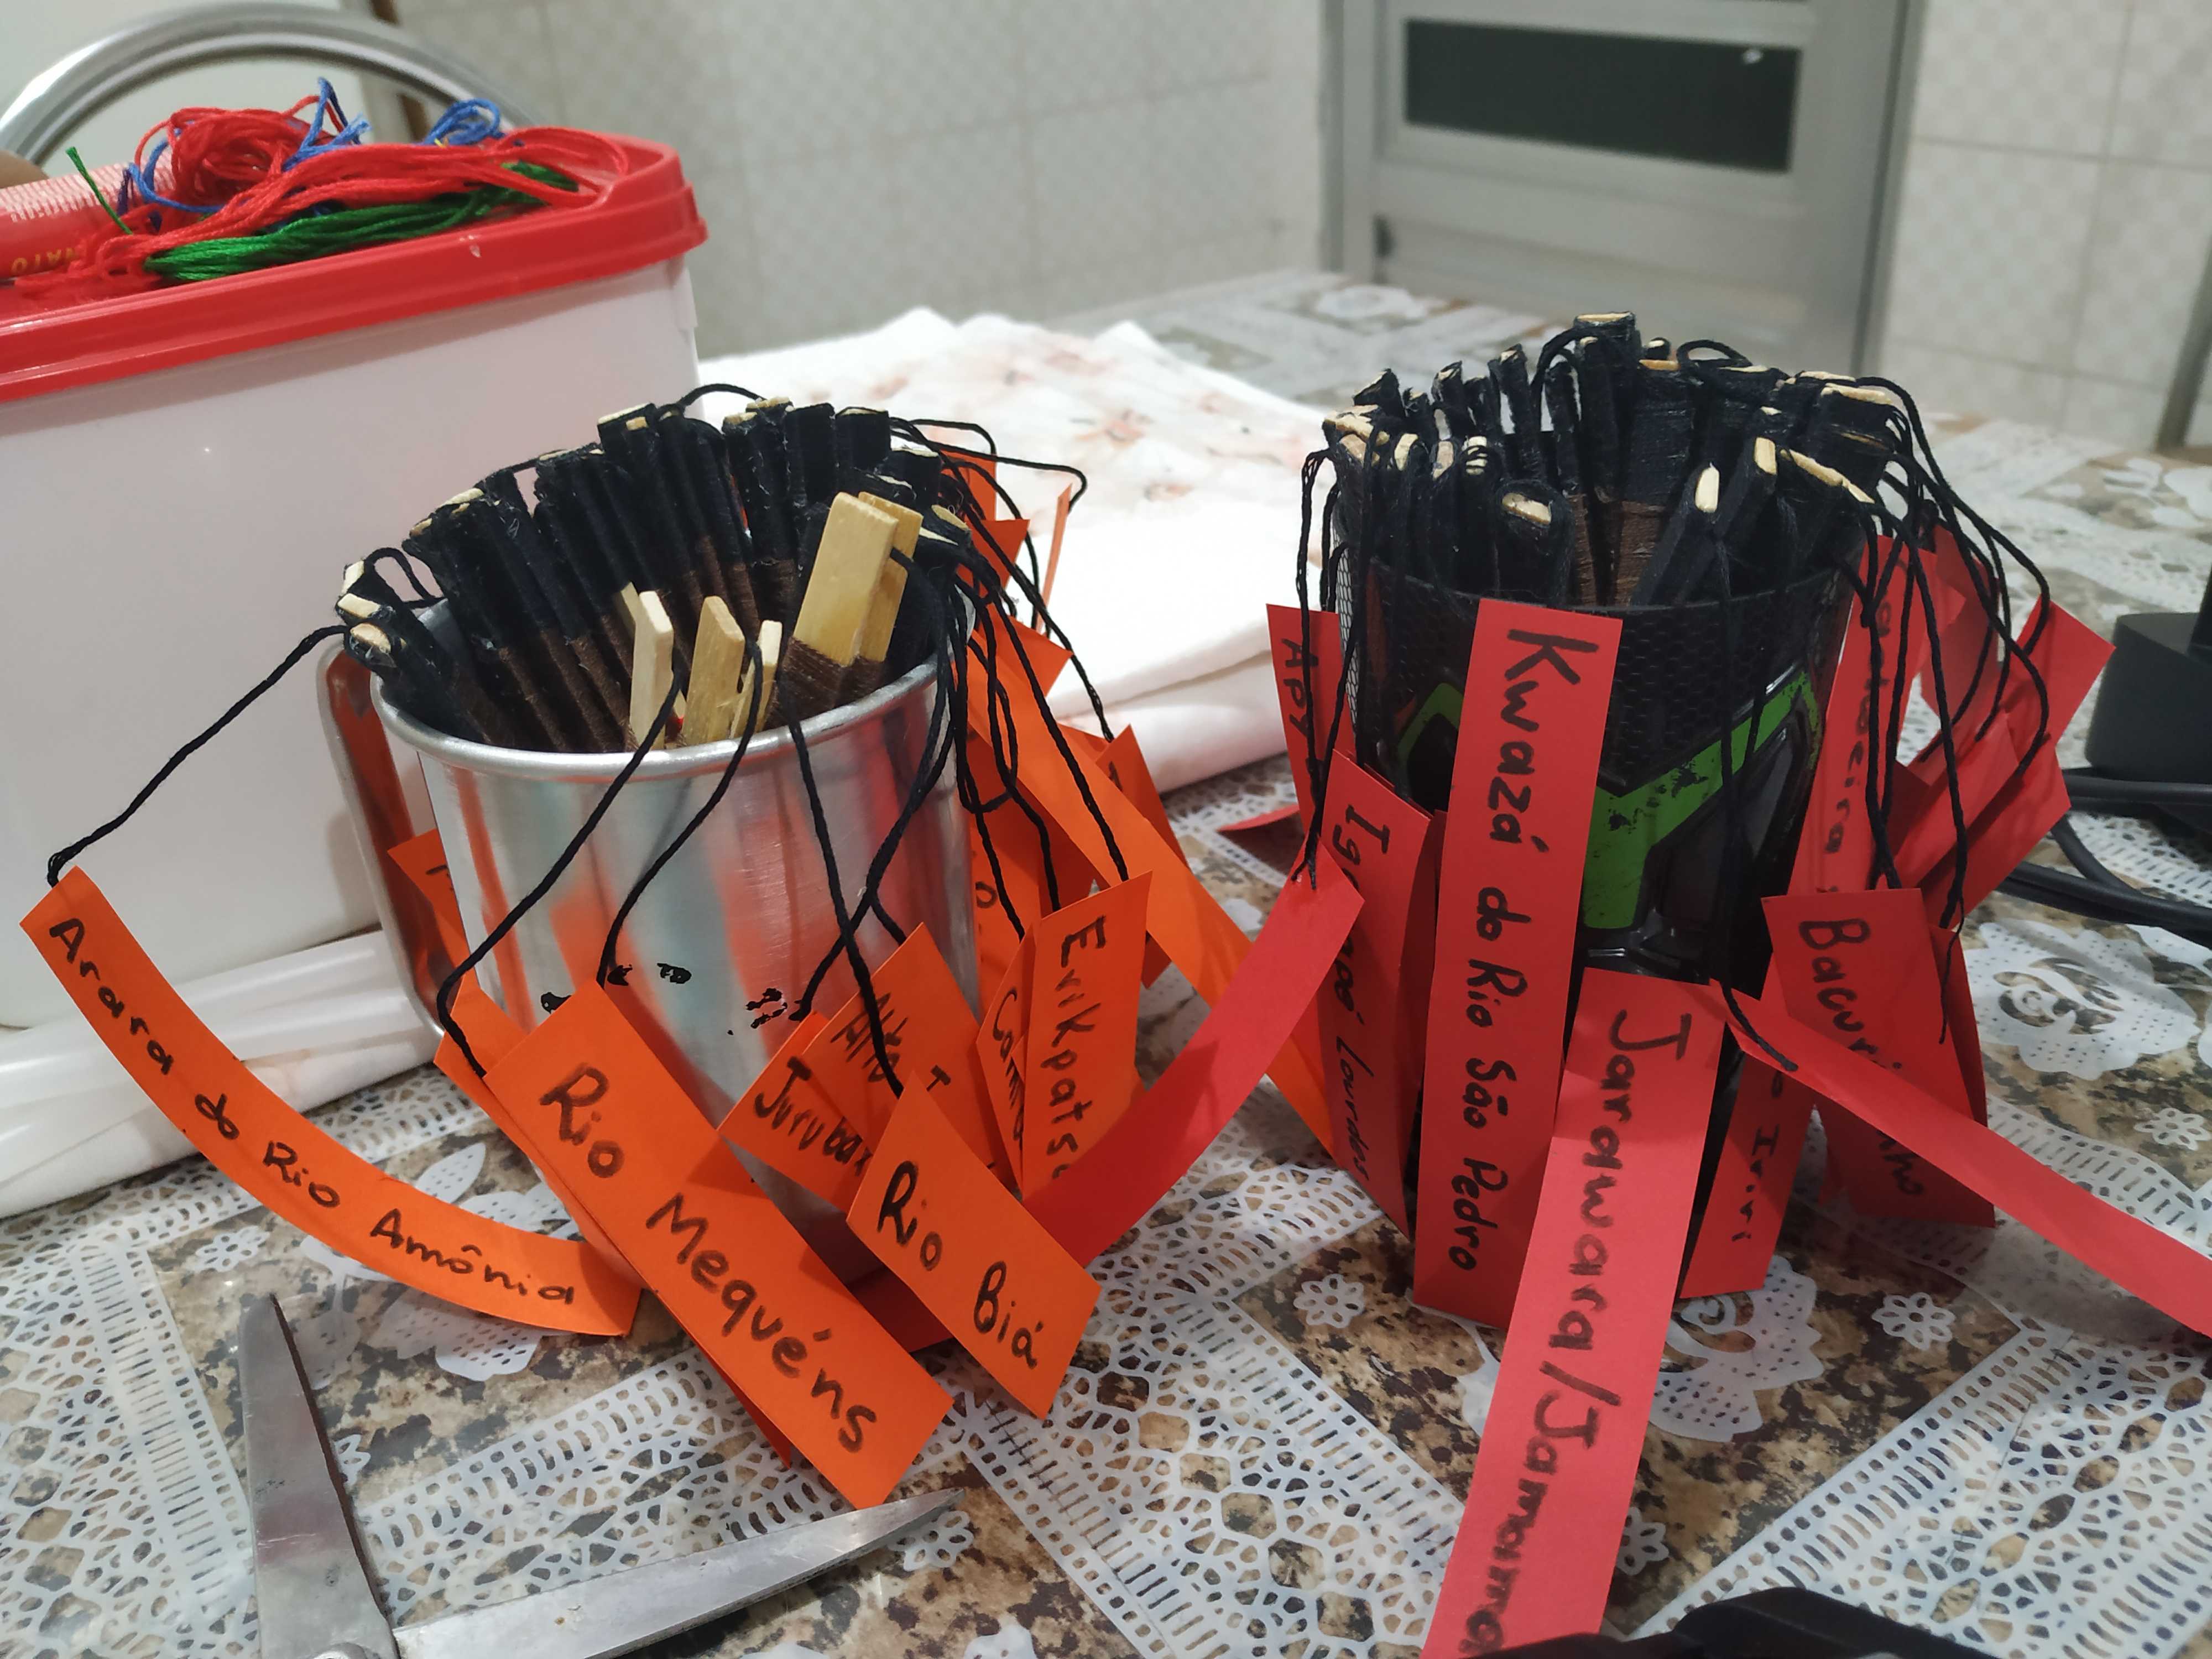
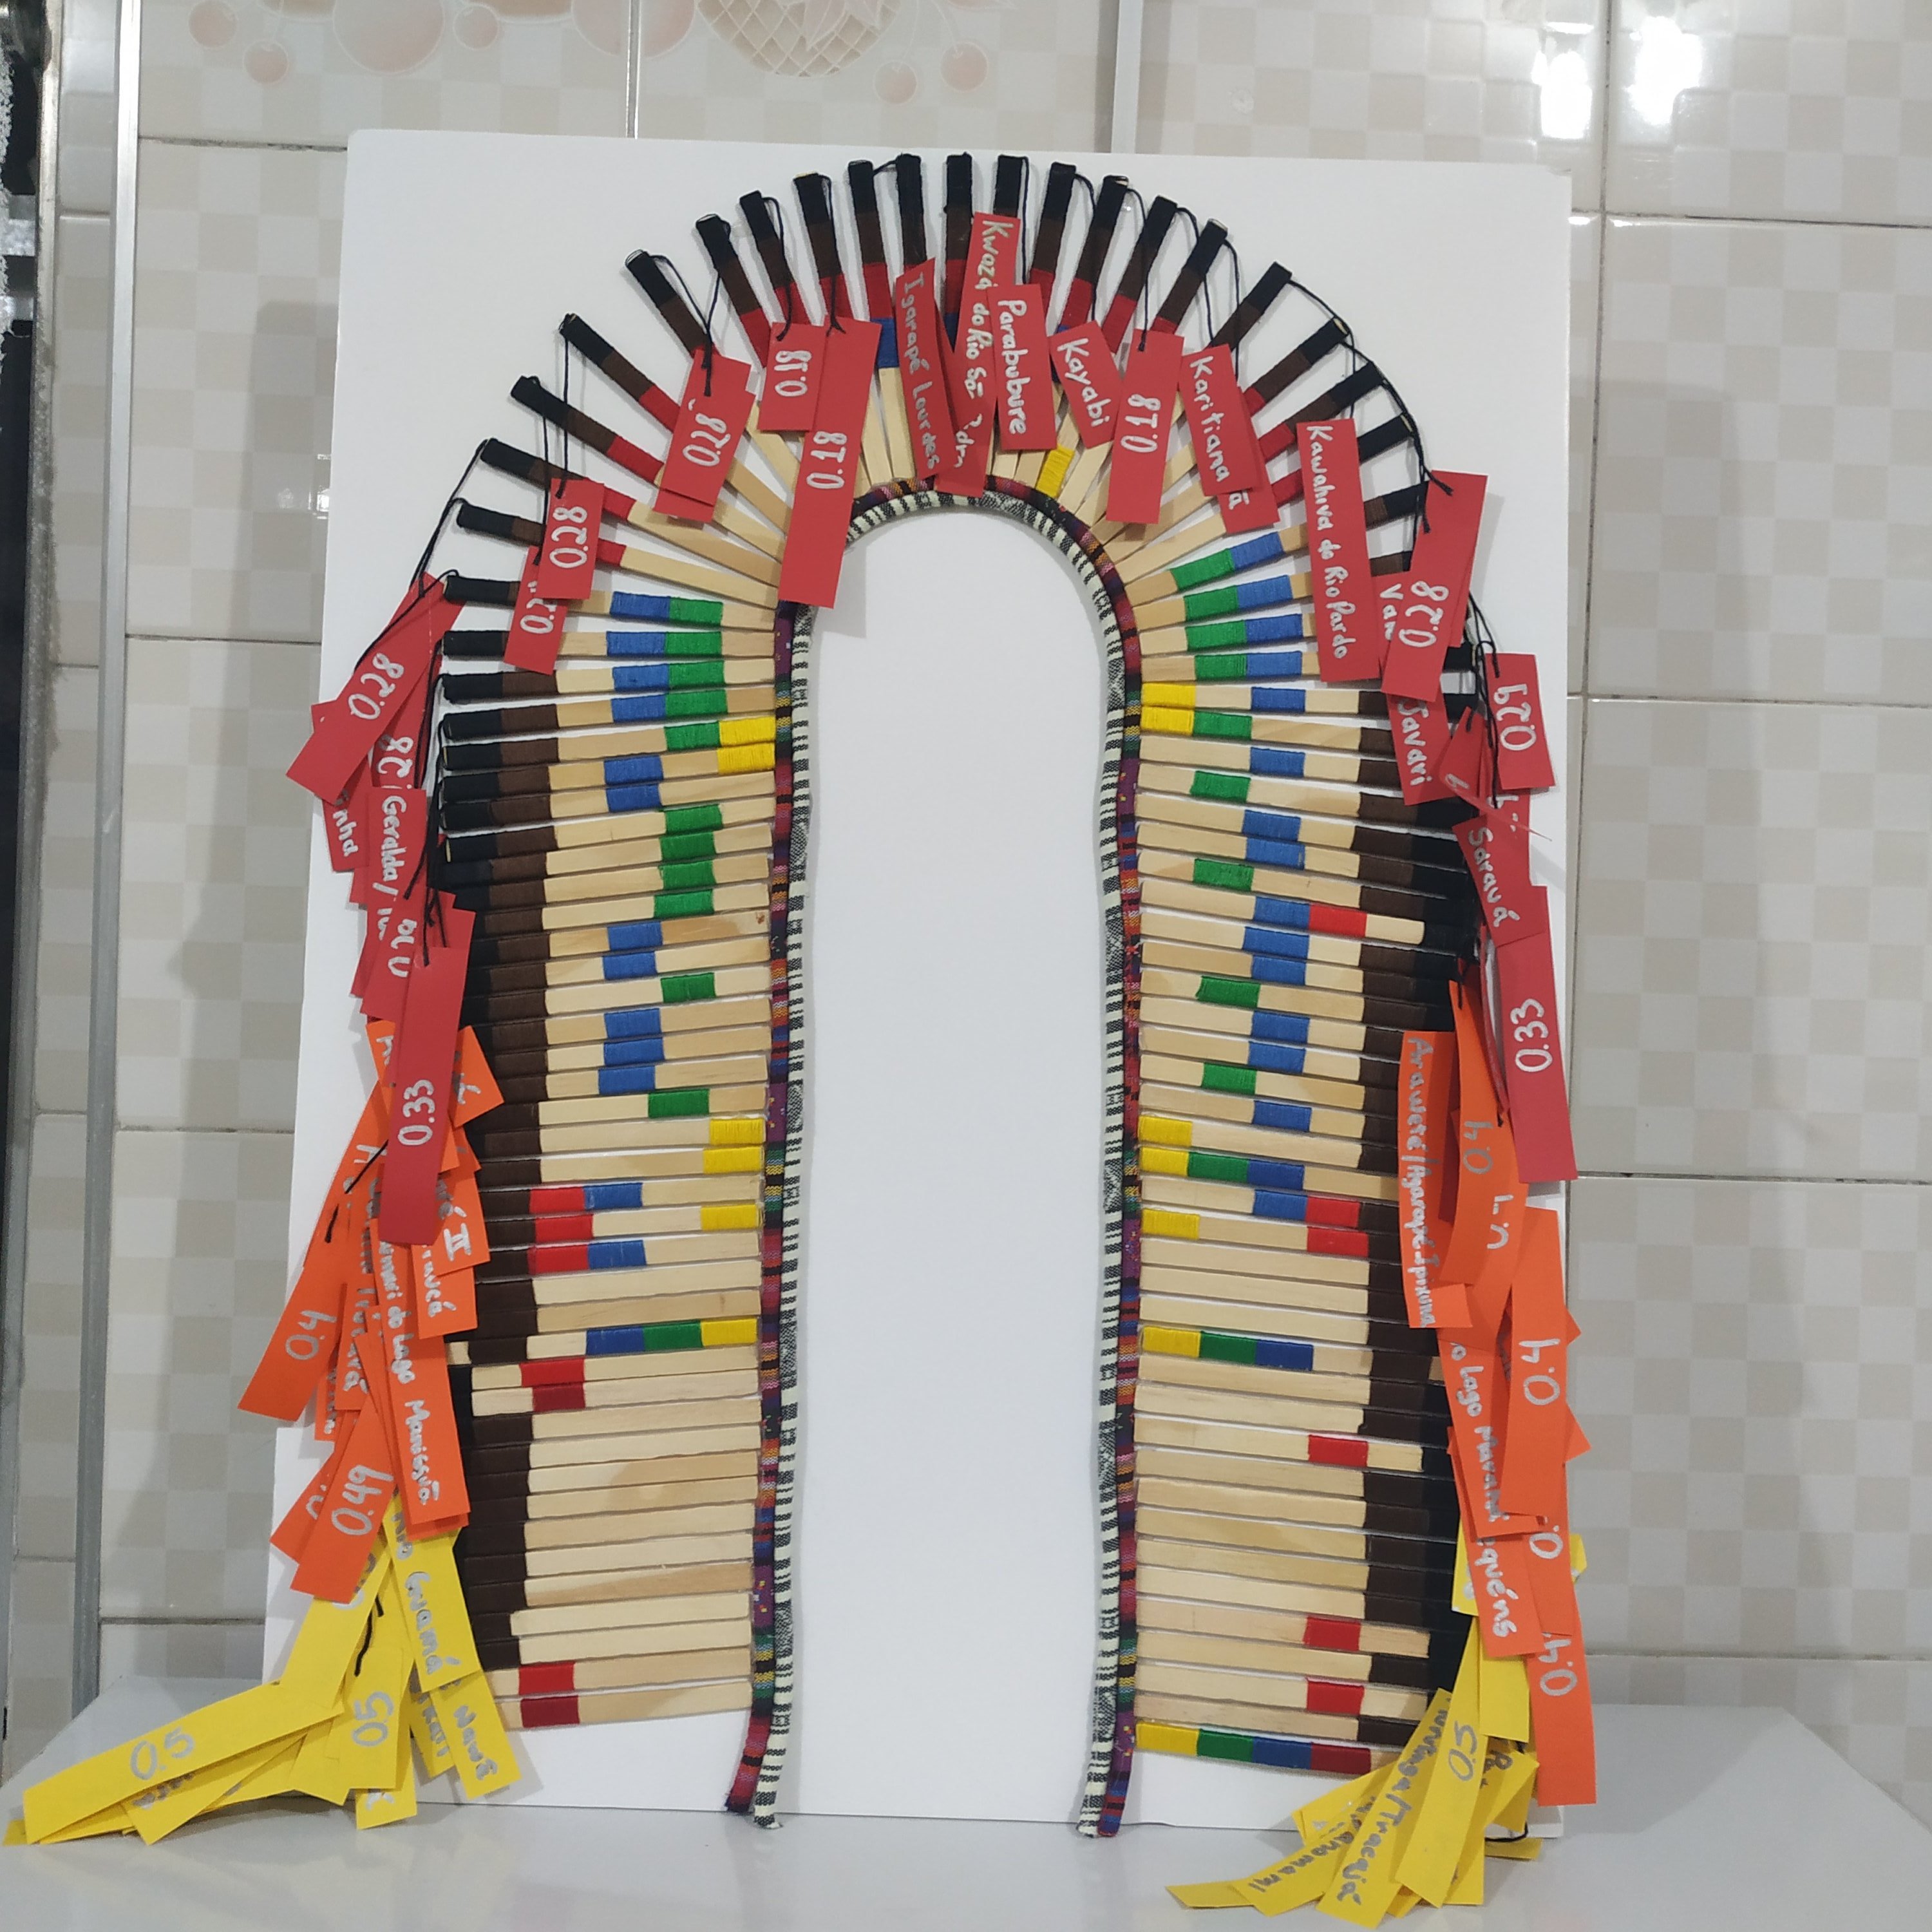
The shape chosen was that of a headdress, a piece of indigenous clothing that varies in its usefulness according to the tribe. The part where feathers would be placed are wooden sticks with embroidery threads engaging them. Each stick represents an area and each thread color a threat. Place names hang like labels, coded in three colors to better separate large / medium / small risk areas. The total structure forms an opposite “U”, elongated and glued on white feather paper, with the name strips hanging for handling, in one part is the name and in the back its number from 0 to 0.5 .

Methodology
TERRITORIAL INTEGRITY
Definition: The indicator assesses the degree of security of the territory, including indigenous rights to the exclusive use of IT and the presence of activities considered illegal to exploit resources and the illegal presence of land by non-indigenous people. The existence of this type of pressure is related, above all, to the presence of non-indigenous people involved in activities considered illegal for resource exploitation, such as gathering, hunting, fishing and logging, as well as the existence of illegal occupants, such as farmers, land grabbers, tenants and squatters.
Components:
- a) Illegal hunting
- b) Illegal fishing
- c) Illegal collection
- d) Illegal mining
- e) Logging activity
- f) Land invasion or threat
Calculation: (a * 11 + b * 11 + c * 6 + d * 22 + and * 22 + f * 28) / 100
About the variables: The compilation of information on non-indigenous illegal use (items a, b, c, d, e) and land invasion(item f) is the result of monitoring pressures and threats such as hunting, fishing and gathering, mining, activity loggers, squatters, farmers and tenant inside Indigenous Lands. Collected from different sources (reports, denunces and news), this information is organized and compiled through SisArp. Land threats and the exploitation of natural resources within the Indigenous Land are one of the major barriers to the indigenous peoples’ right to exclusive use of the territory.
Codification
Therefore, I took the liberty of adjusting each one by its respective impact weight for the territory and coded them in one color:
Illegal collection – Yellow
Illegal hunting – Green
Illegal fishing – Blue
Illegal mining – Red
Logging activity – Brown
Land invasion or threat – Black
The colors on each stick start from top to bottom, the first of the highest weight and present in most territories, totaling 91 of the 100: land invasions or threats, followed by 89 loggings activities, 34 illegal minings, 40 fishings, 27 huntings and, finally, 15 illegal collections. The frequency of each color varies, but it certainly reaches the integrity index depending on the variation in weights as it is possible to physically visualize in the project.
Conclusion
There has been a lot of research to the present result, where I could get more updated data. The Latentes project was an option, but it already had a map, and was well defined in what needed to be indicated. Already Terra + had subquestions that interested me more in representing physically and that had not been first presented. The first focus of the research was the search for imminent land threats, not the state that was demarcating land for the government. IBGE only contributed to the presentation of the census and the distribution of indigenous people in urban and rural territories. ISA presented important charts and maps, as well as Terra + itself. But the data was not complete or the threat variables were only briefly mentioned. Until a union of this data and the index analysis measure is projected.
Visit labvis.eba.ufrj.br for more.