Education and social development around the world
Education index analysis and world social development
The project consists of an interactive visualization of historical data on education and social development around the world, from the late 19th to the early 21st century. In addition to cross-referencing data on education and human development (HDI) and economic (GDP per capita) and then establish corelations.
1st Data collect
Initially, data collect provided information on education in each country of the world (first, second and third grade) and the average literacy of the population in a given year.
Based on this, ideas were developed that could bring the user to interact with this data, either through a question (using country and gender) to see the data about that region, and the chances that a person under these conditions would have to be literate and have a certain level of education; or by exploring a map that would bring data on one grade level in all countries simultaneously.
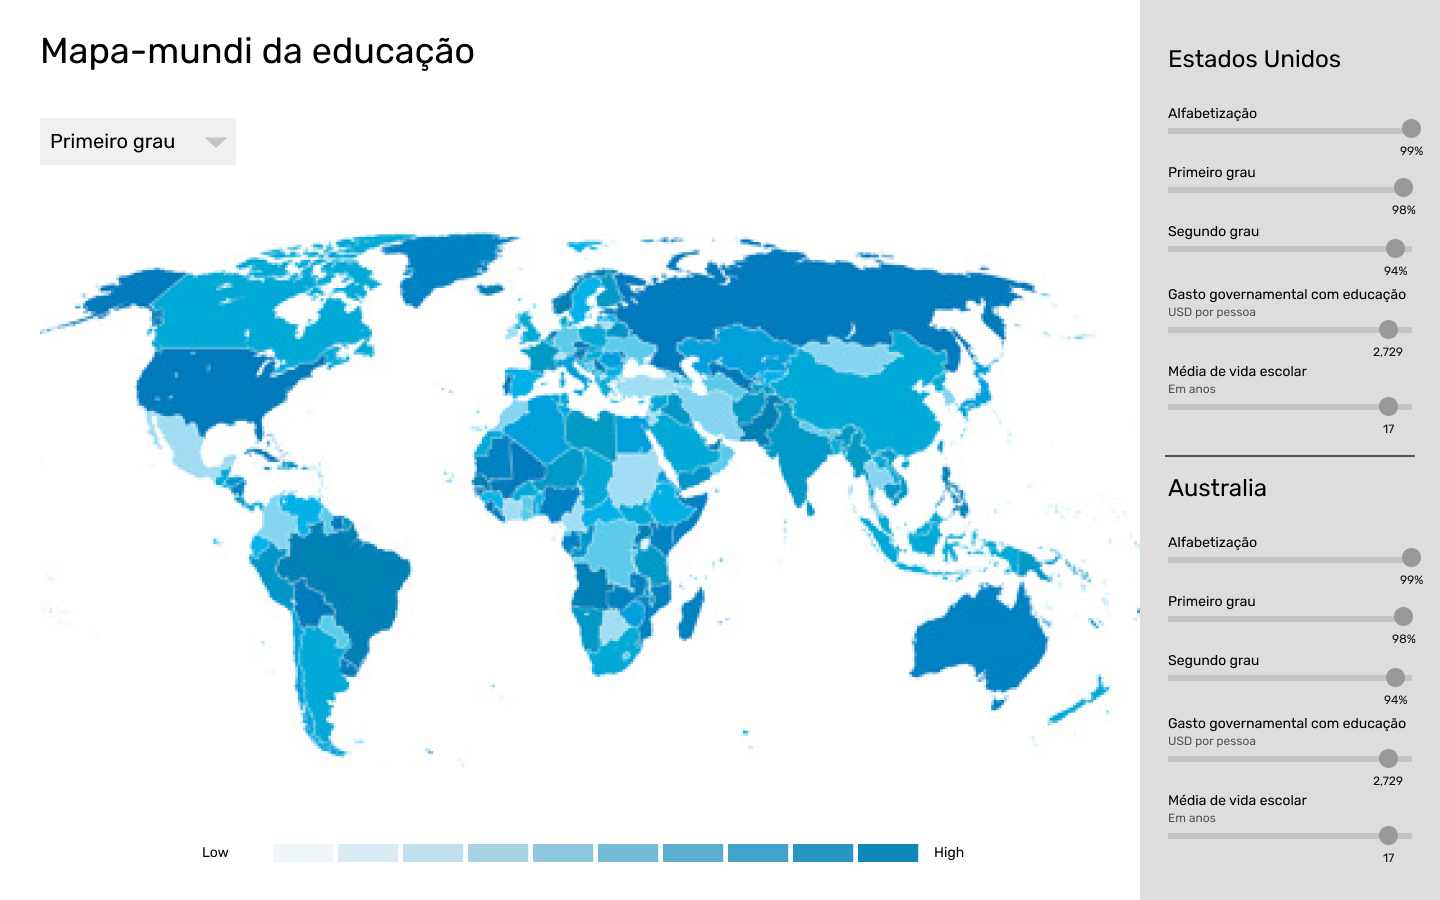
These sketches, however, raised one question: each level of education (first, second and third grade) could only be viewed individually, allowing only one cross of data between countries. Based on this, new studies began, abandoning the maps and bringing scatter plots, so that would could cross two types of data and present them at the same time.
Although the new graph allows for easier comparison, the data themselves did not bring relevant knowledge when cross-referenced – countries with high levels of education had high levels of education at all levels; and countries with low levels of education would also have low levels of education at all levels. Therefore, was identified that there was a need to obtain other data that would allow us to bring more relevant conclusions.
2nd Data Collection
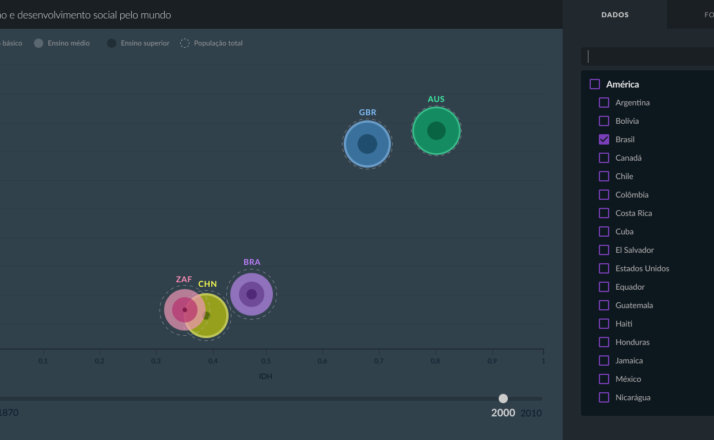
In the new research, through different sources, it was possible to obtain data on education in each country and information on human and economic development. With these 2 data cores (education and development), it was possible to create better relations between information than was previously possible.
Besides the new data groups (HDI and GDP per capita), it was also possible to obtain all data over a much longer timeframe. In the first collection, there were data of only 1 year, and with the new collection, was obtained historical measurements dating from 1870 to 2010.
Data processing
The treatment of these data required that common criteria be established for all measurements. At the end, the established time interval was between 1870 and 2010, with a periodicity of 1 measurement every 10 years.
Result
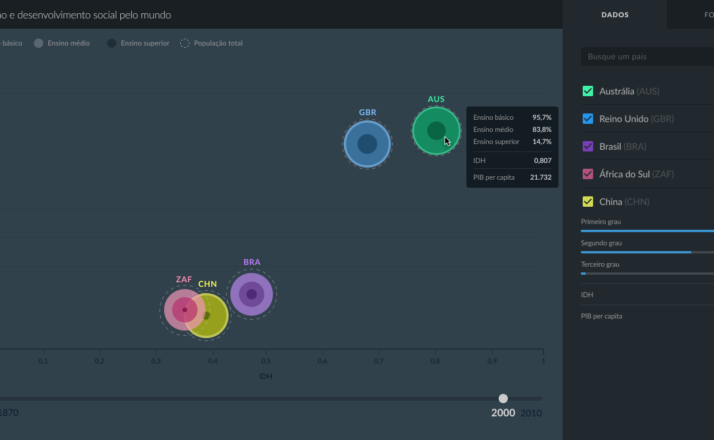
Was created a visualization that uses a three-level bubble chart for each country. Besides a timeline that can be navigated by selecting a point or pressing play. This was the way we found to clearly present all data about one country at the same time.
The spatial position variation (the dispersion) presents the socioeconomic indices; Color represents the continent of each country; And the bubble area represents the percentage of the population with a certain level of education.
Because they have a hierarchical relationship (First Degree> Second Degree> Third Degree, necessarily), it was possible to create an overlap of area graphs that indicate each educational level, without the problems normally faced by overlap affect the understanding of the information.
Therefore, it was possible to view all data for a country simultaneously, and observe its progress over time.
The project was developed by Barbara Frast as a work in the Interactive Data Visualization project discipline, and was oriented by Professor Doris Kosminsky.
Visit labvis.eba.ufrj.br for more.