Visualizing Visualizers: Collaboration Networks
Introducing the project
Visualizing Visualizers is an interactive visualization, designed and developed by Doris Kosminsky, Lucas Barcellos Oliveira, and Claudio Esperança, which presents a collaboration network of visualization researchers. Several conferences and journals publish research on information visualization, showcasing interdisciplinary collaborations that bridge multiple areas of knowledge and integrate research communities across continents. In this artwork, we searched for the lifelong collaborations of over 1.4 million authors registered at the DBLP computer science bibliography as of September 8th 2019, totalizing over 4.8 million publications.
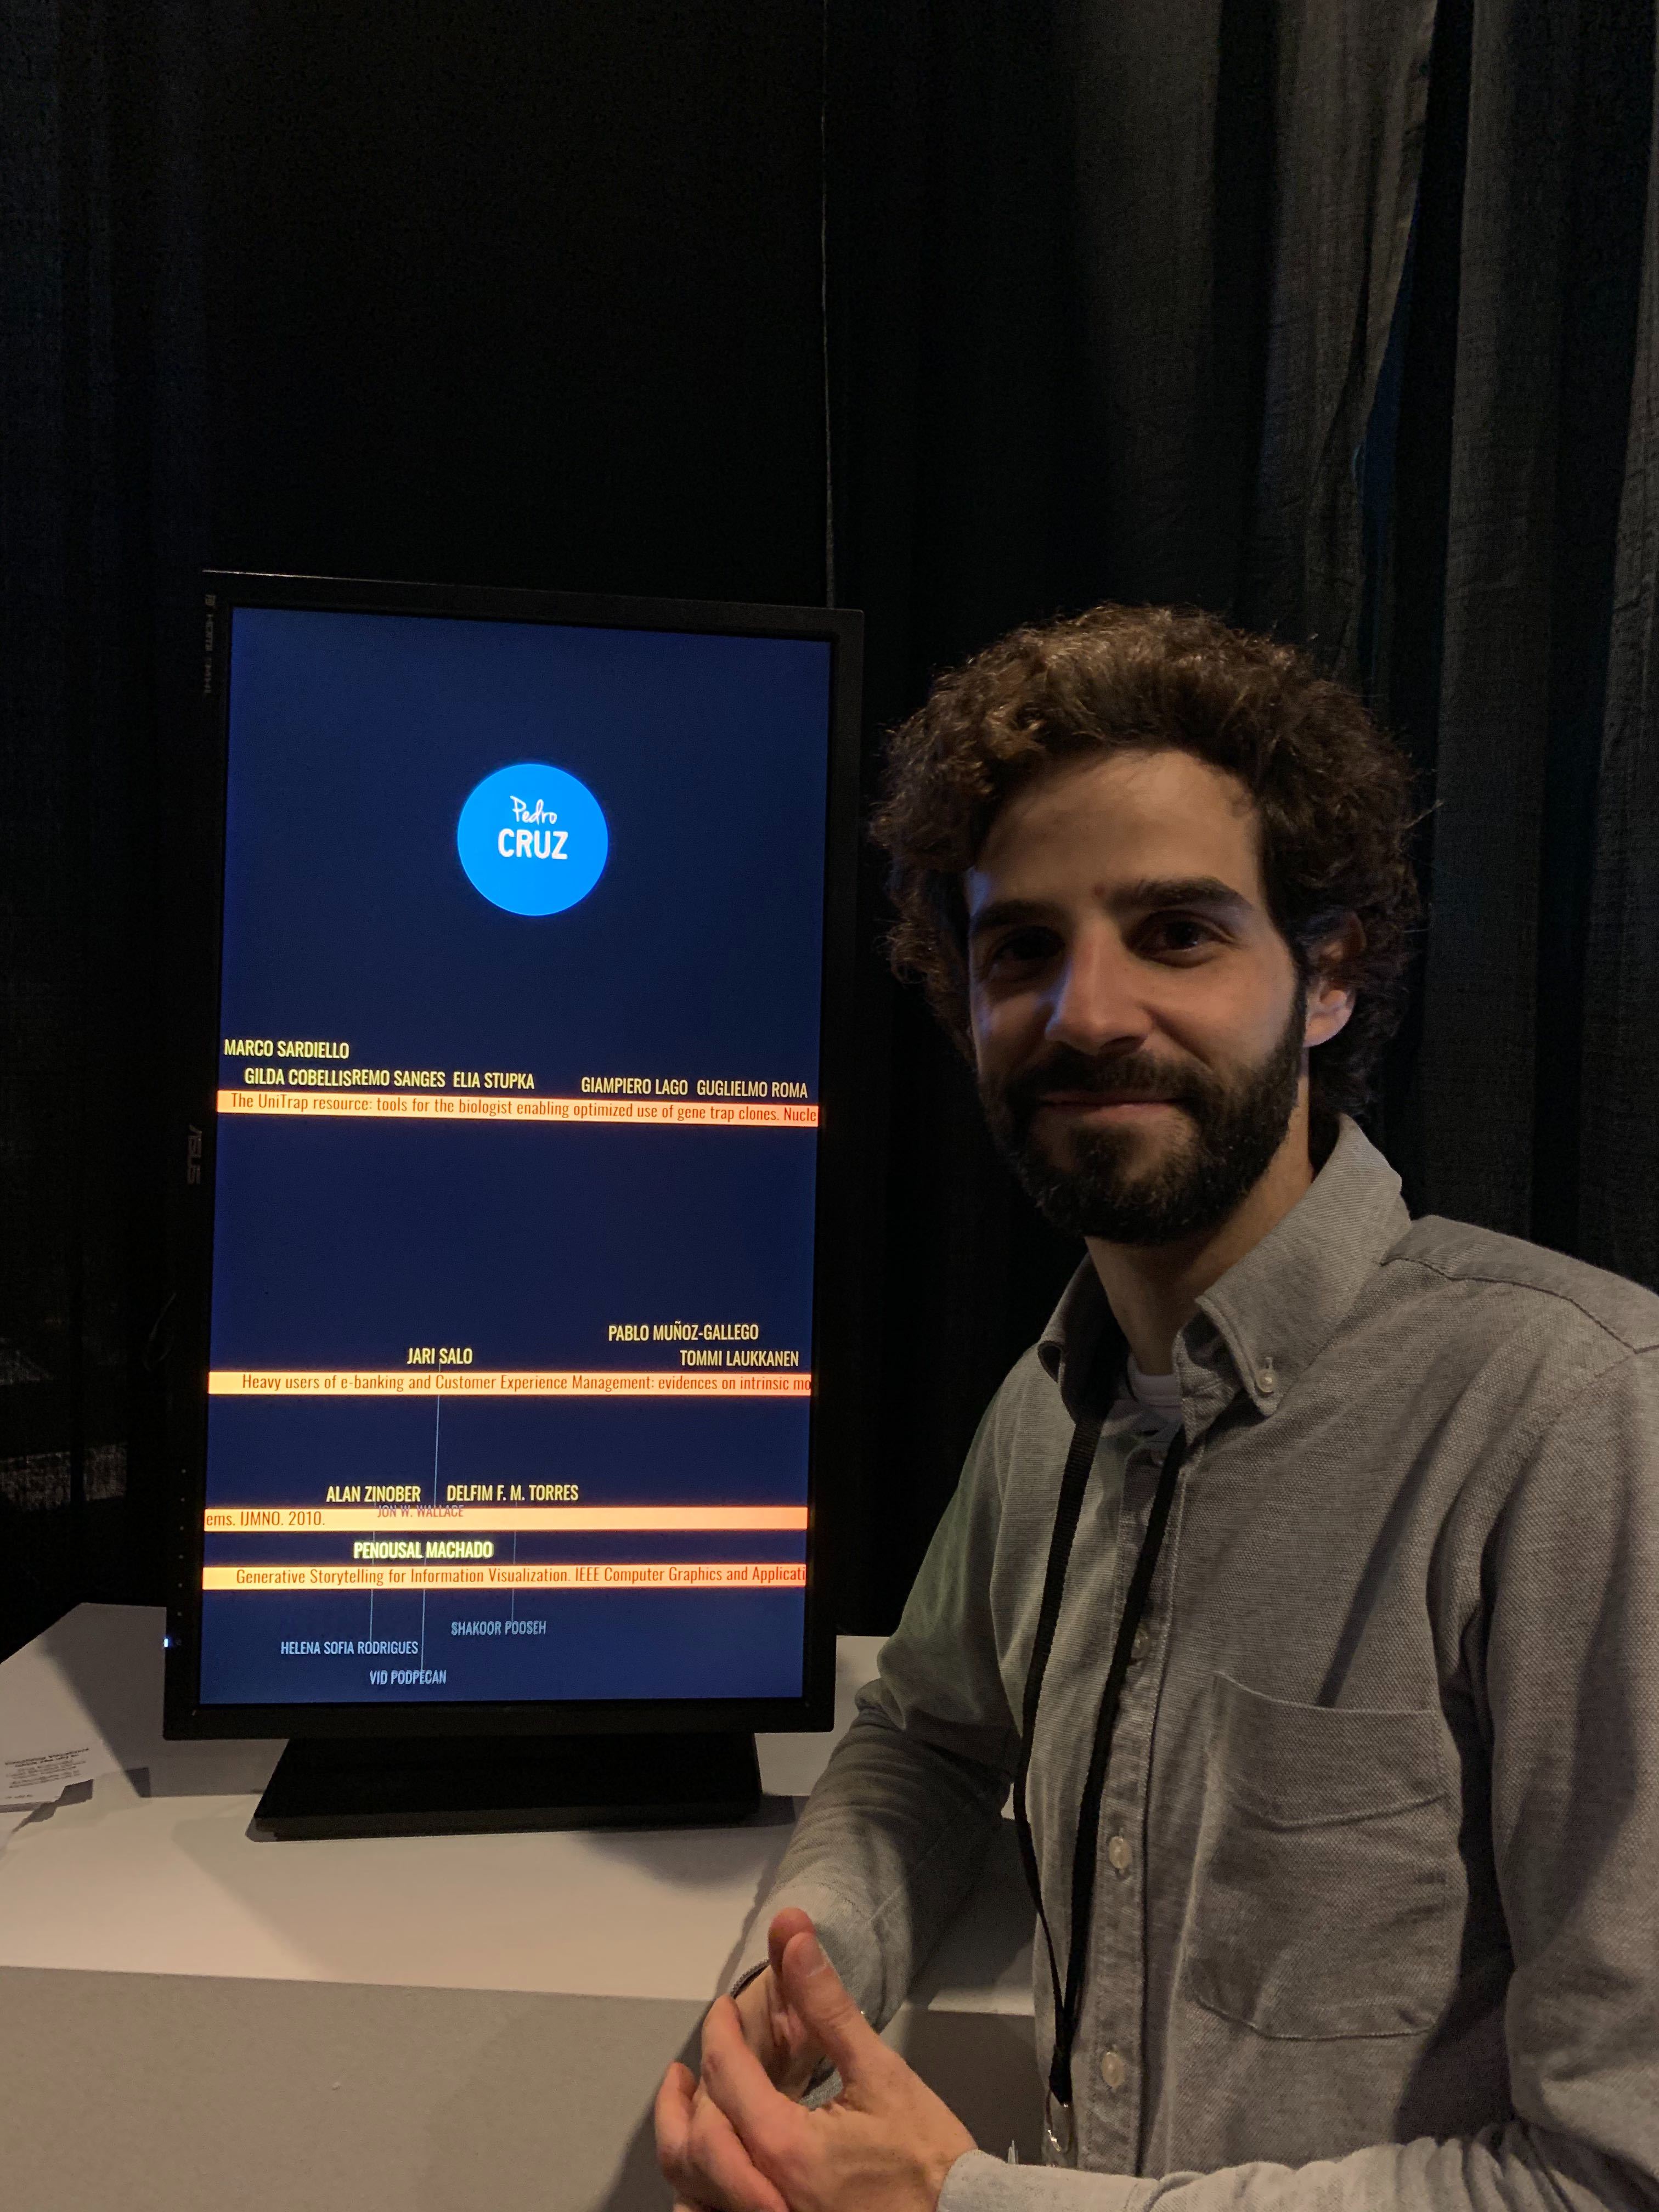
Upon interacting with Visualizing Visualizers, the visitor can search for a DBLP researcher to see their collaborations. After the input of the researcher’s name, the visualization highlights it. Unlike other network visualizations, we didn’t use edges and nodes to visualize the relationships between collaborators. We animated the researcher’s peer names, the titles of the papers published in collaboration, their venues, and years of publication. The visualization emphasizes the frequent collaboration partners and the most recent papers.
Ultimately, in Visualizing Visualizers, the artists are interested in exploring alternative aesthetic possibilities for a network. They hope to engage the visitor through aesthetics, interactivity, and animation.
See a small video on youtube.
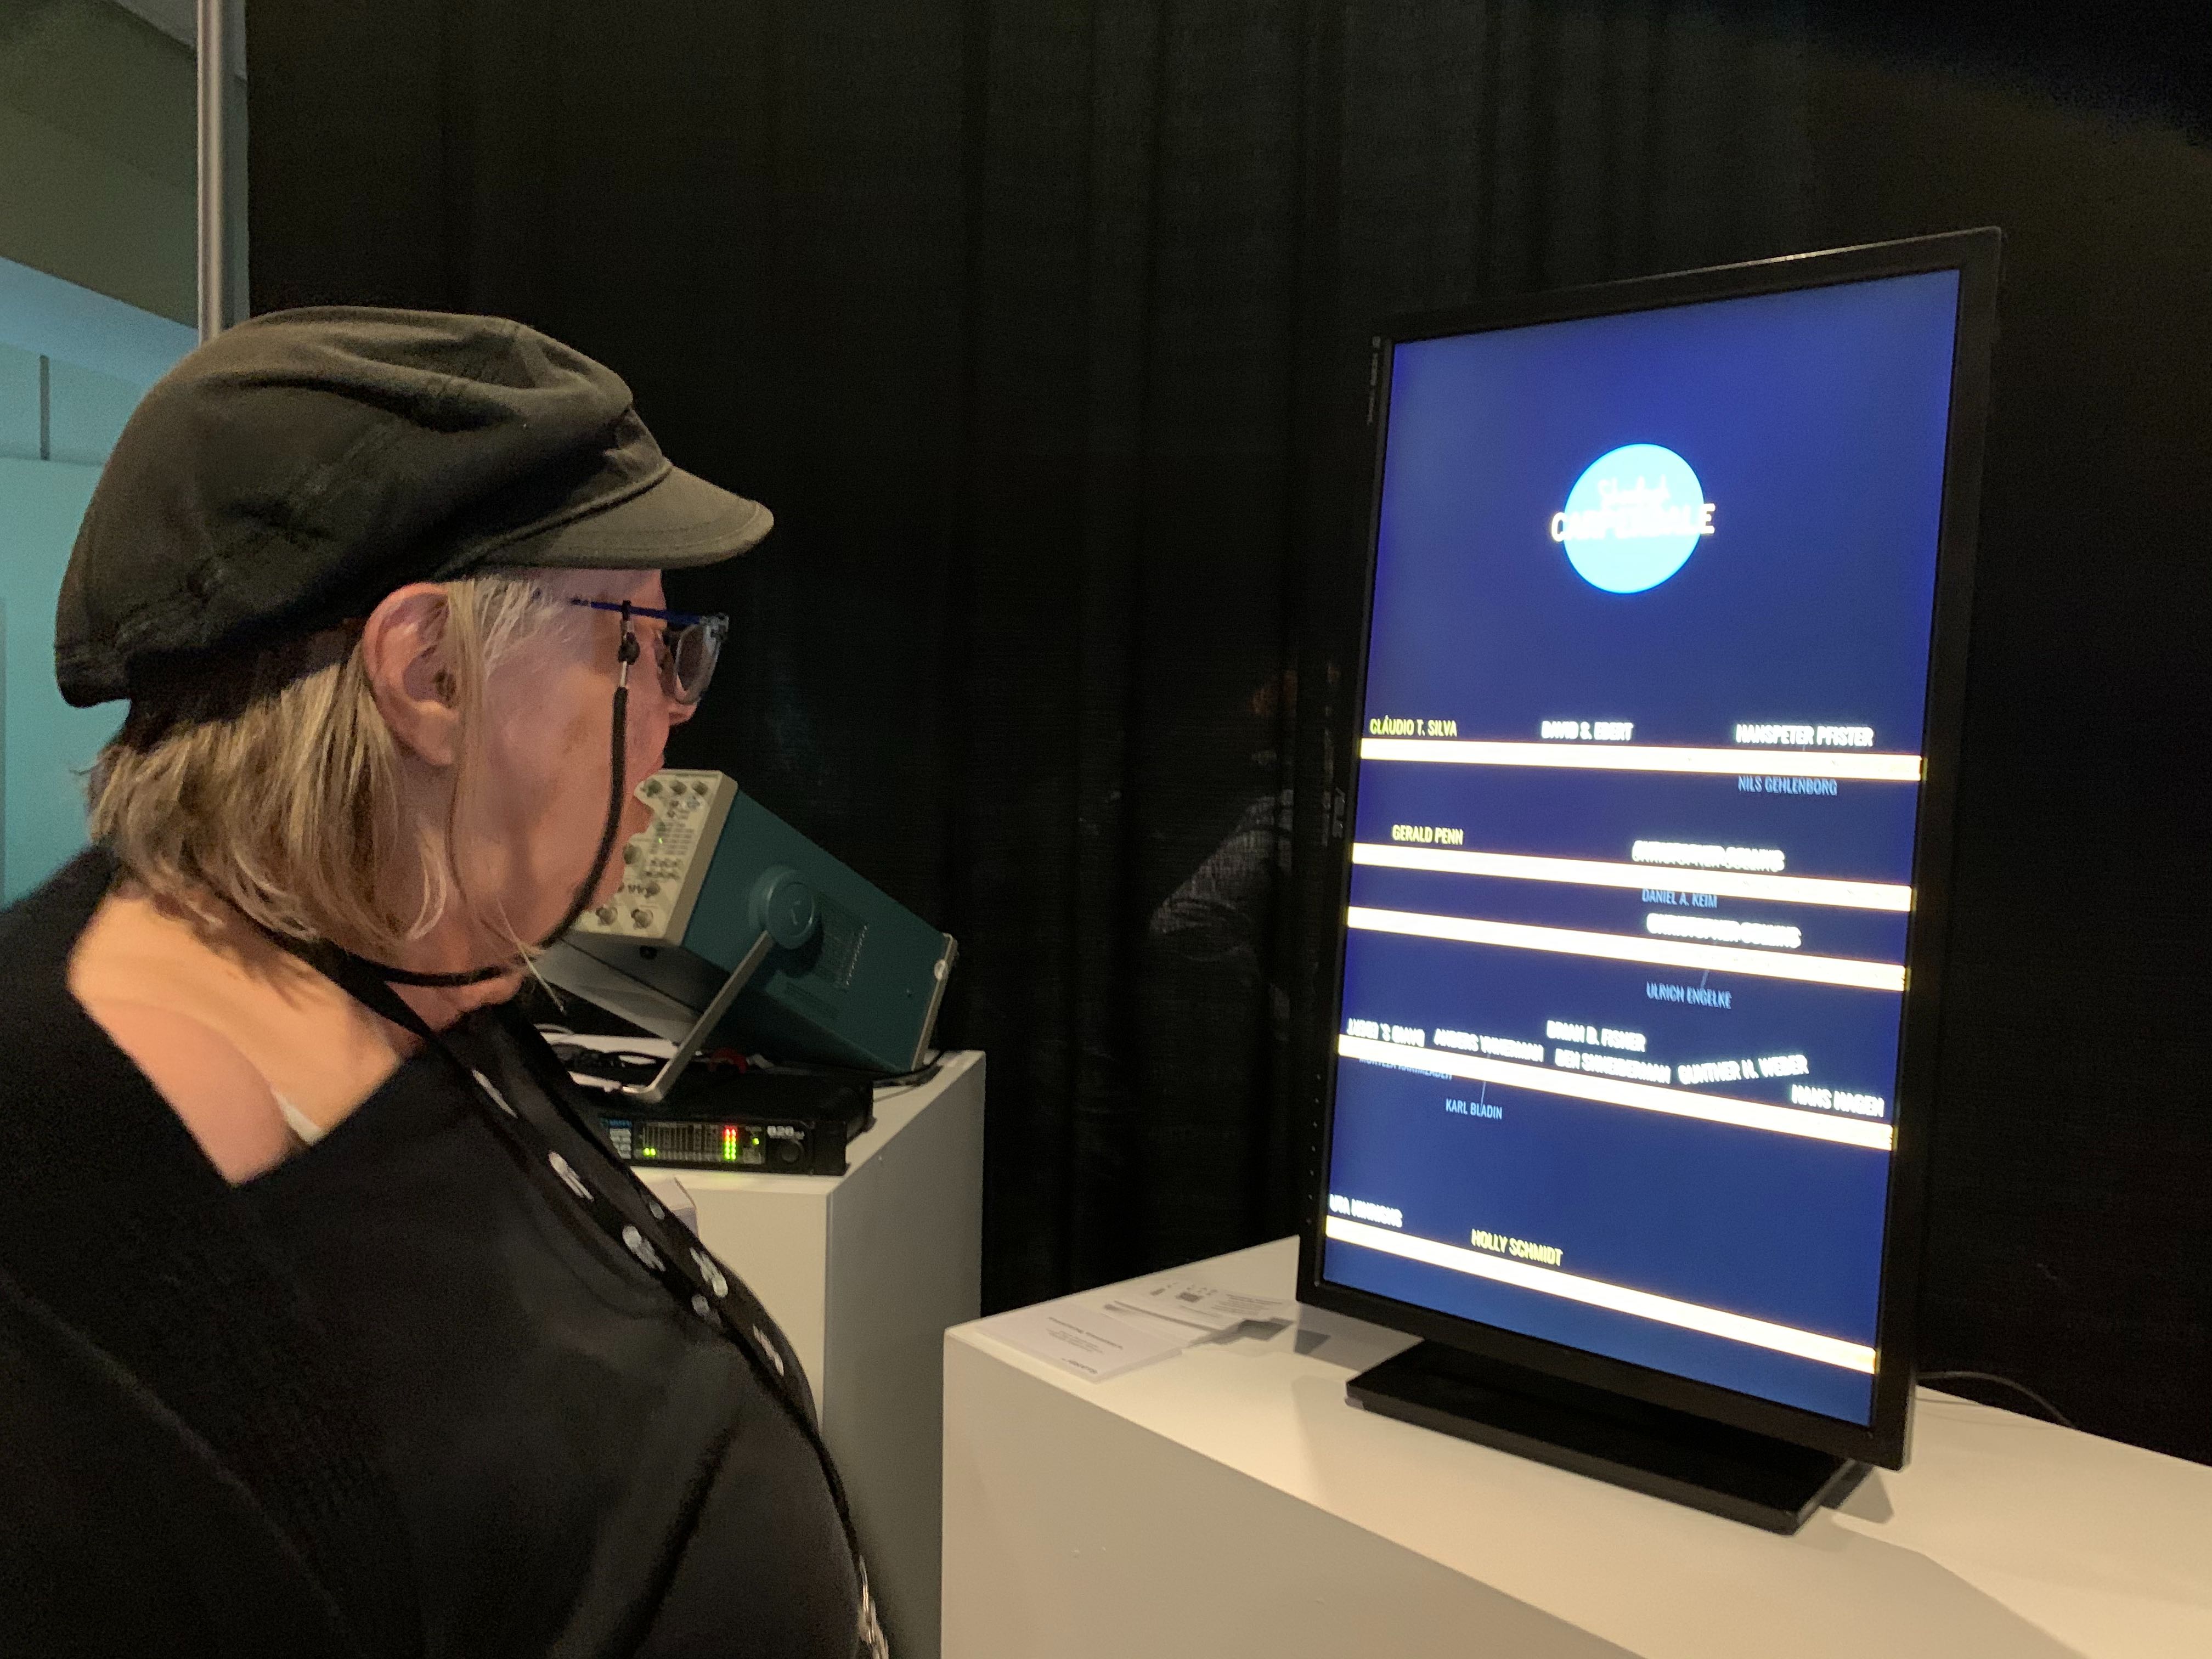
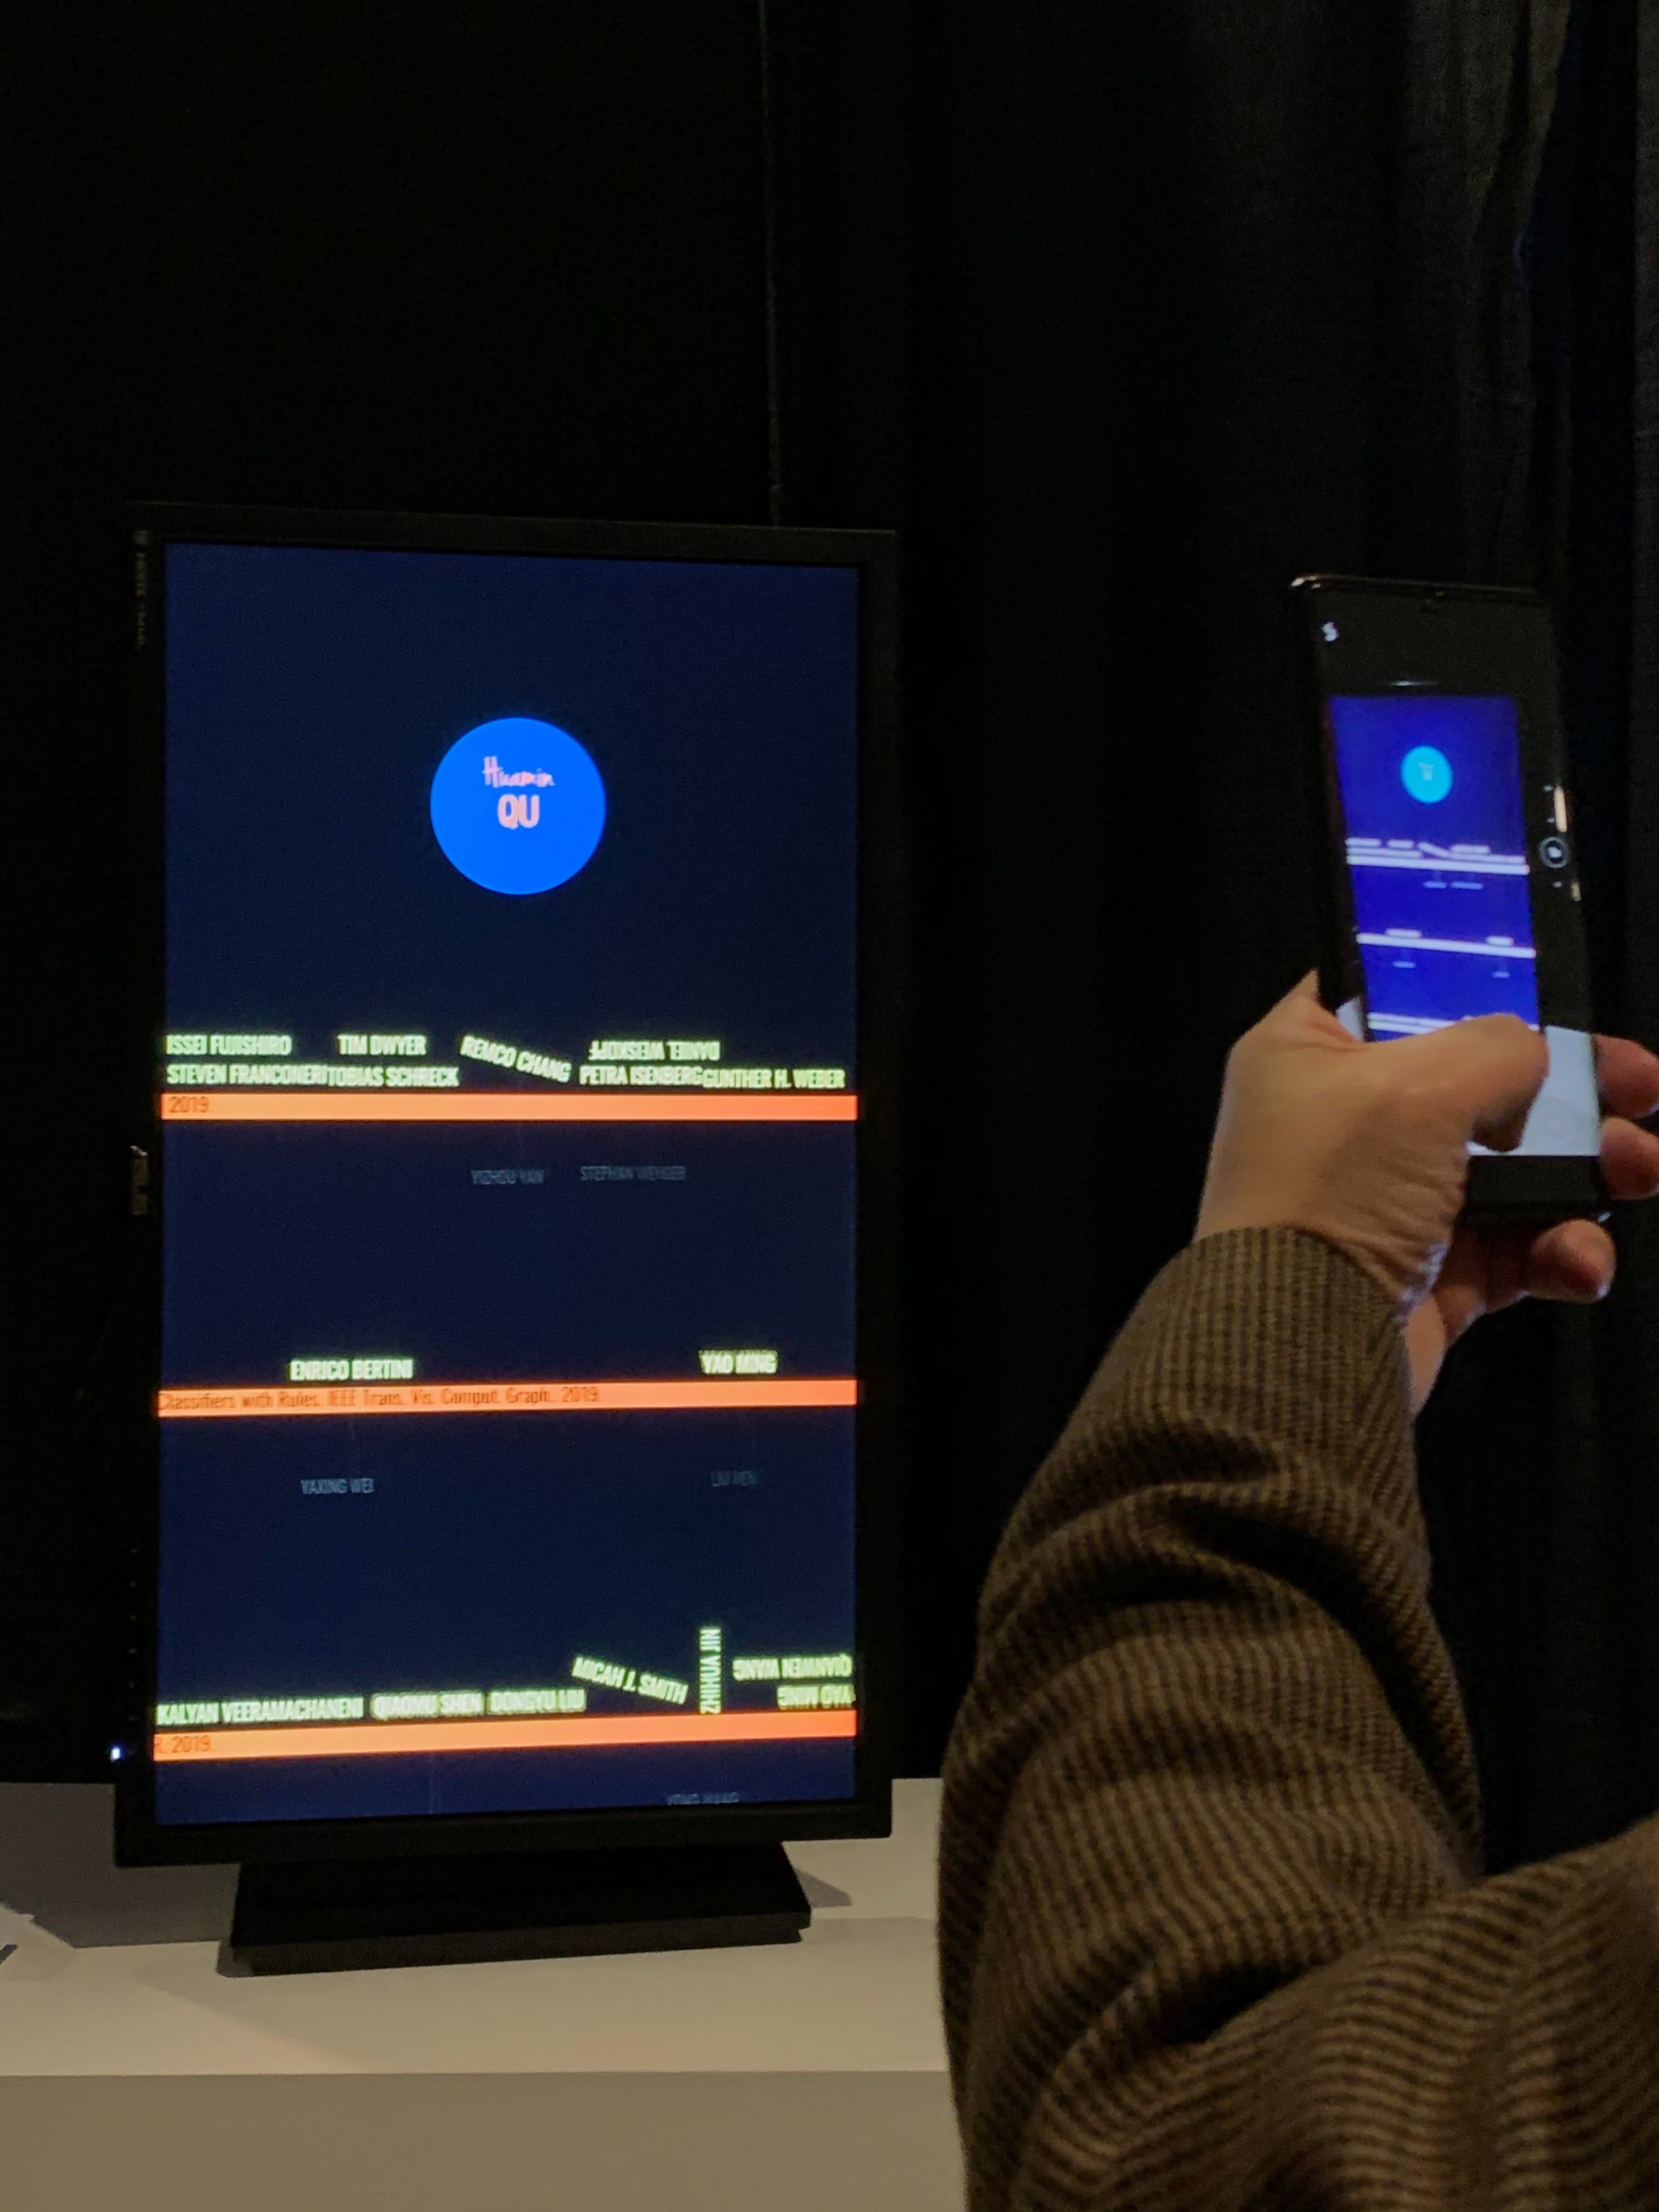
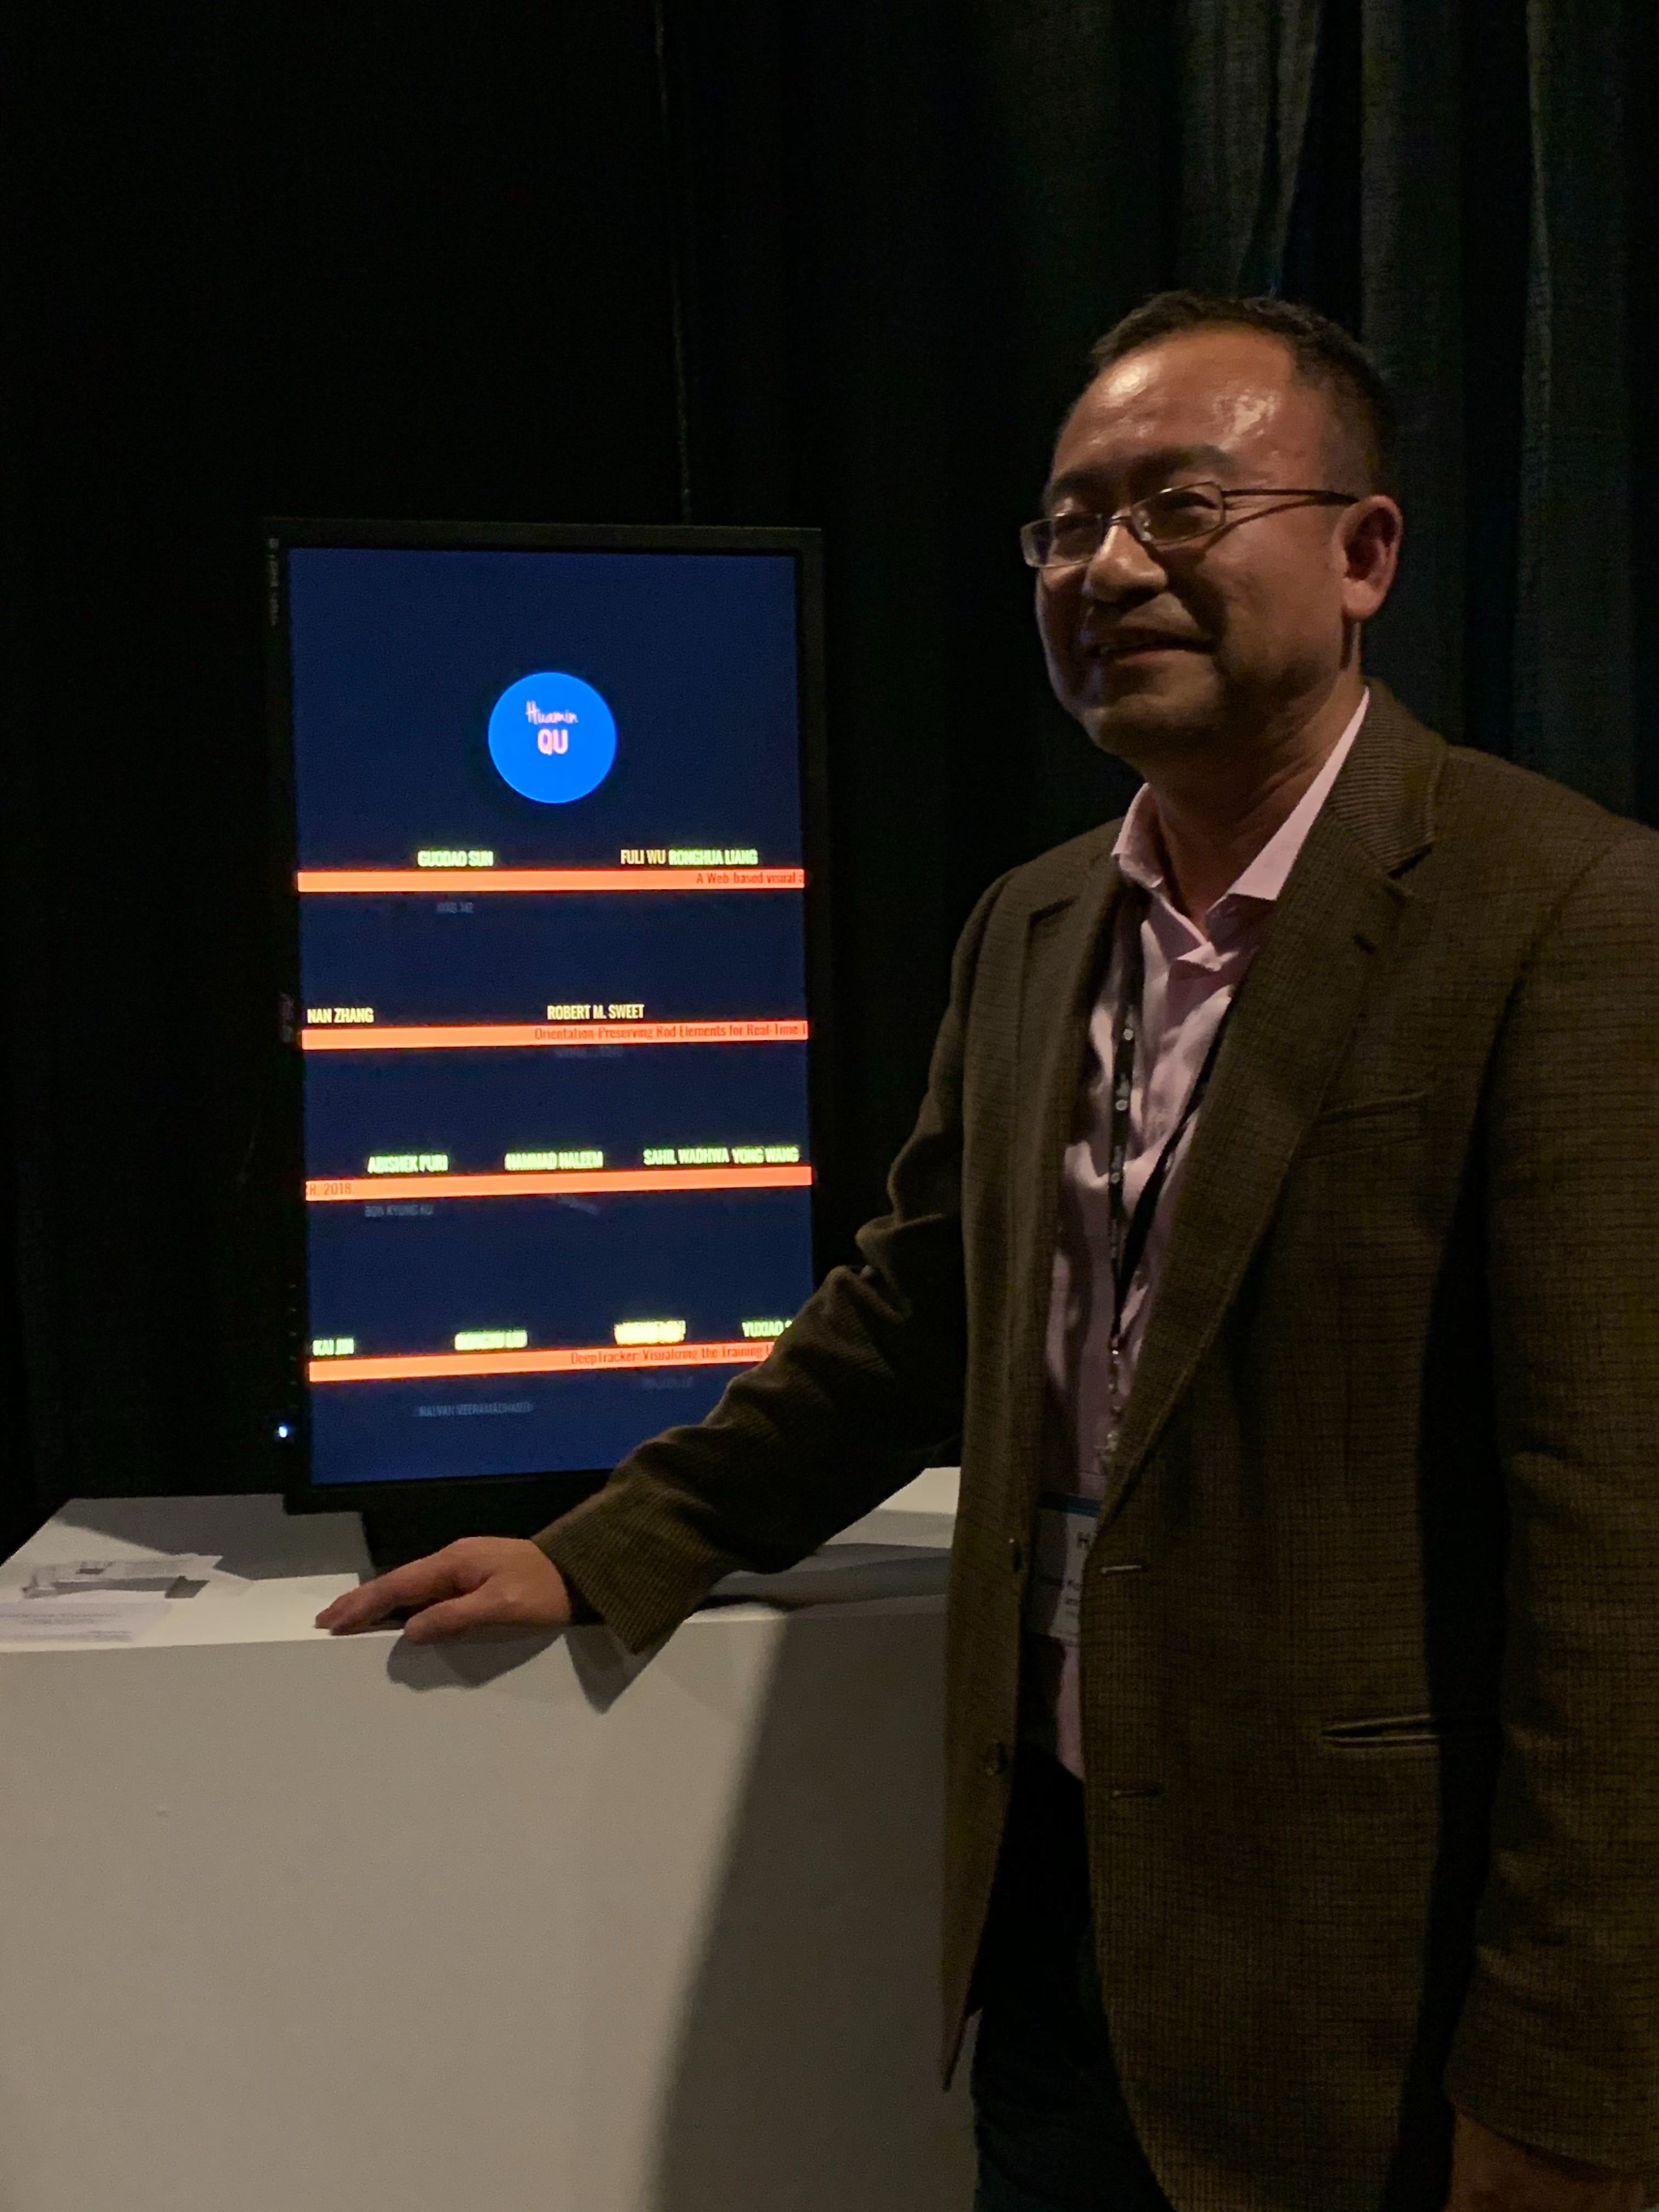
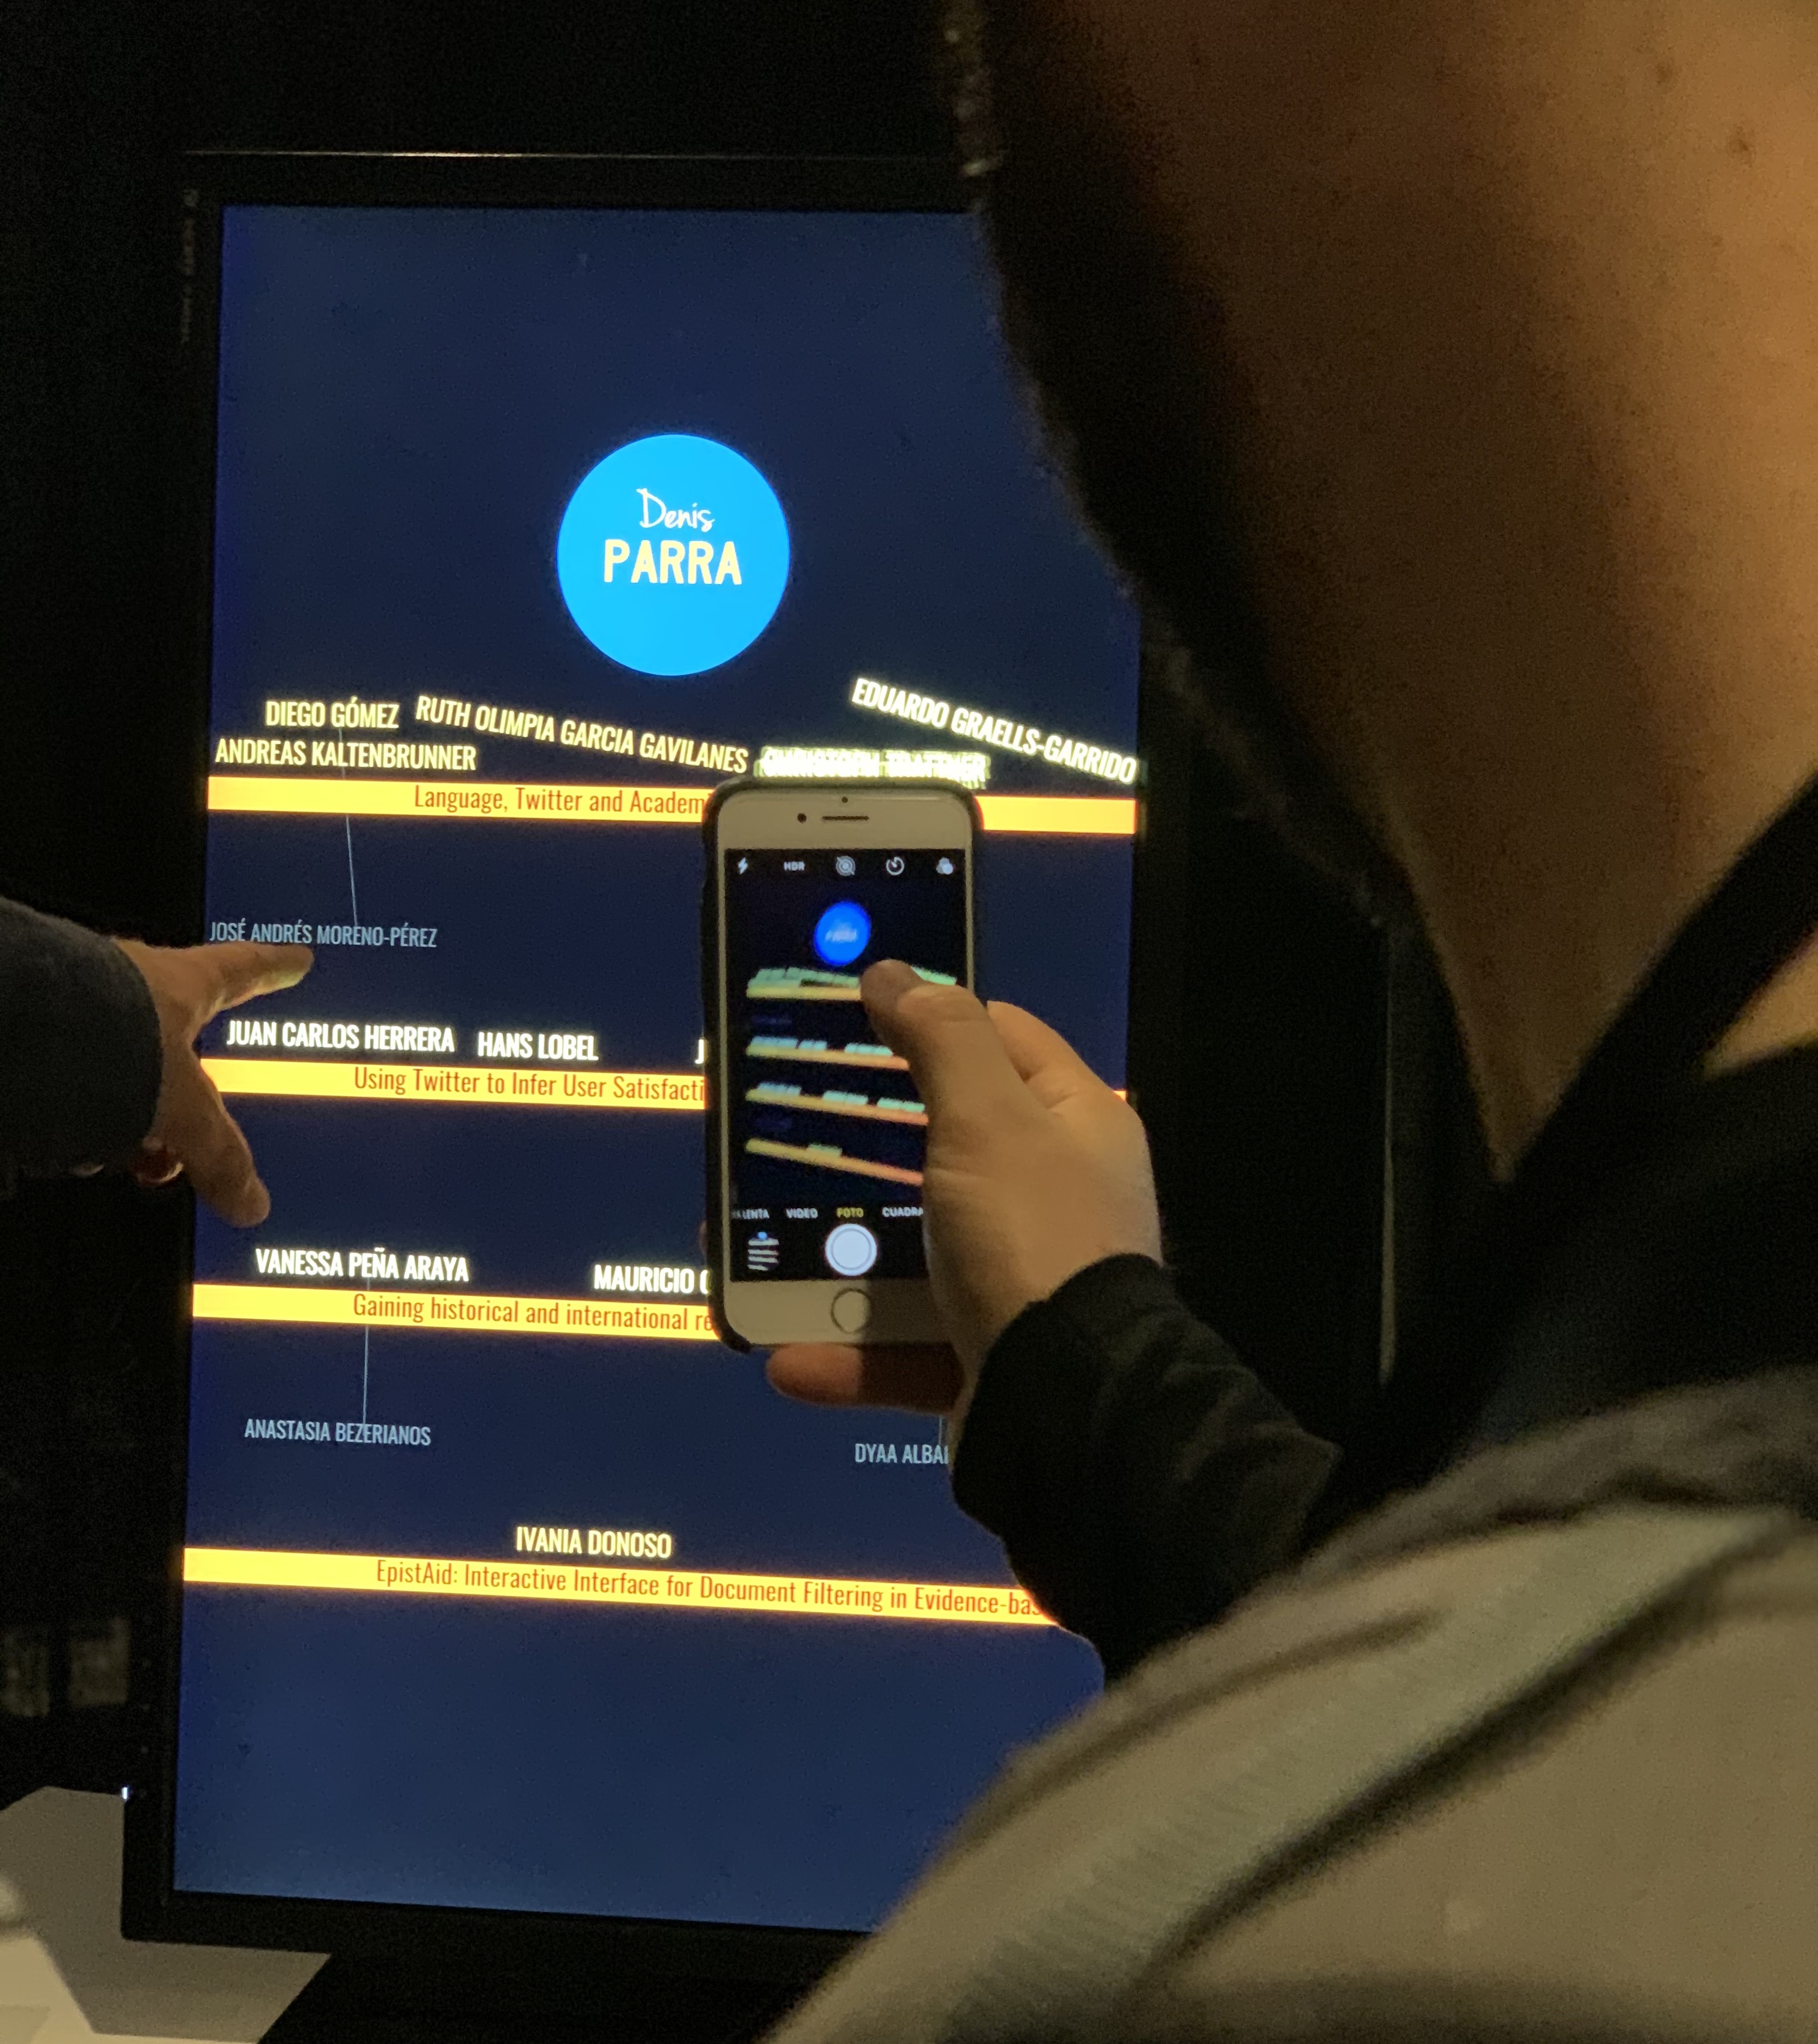
People in the show interact with the screen, showing their network
Technical notes
We conceived this artwork to offer an interactive exploration of research collaborations. Here, we were concerned about choosing a researcher’s name. We invite the visitors to use the touchscreen keyboard to select a researcher’s name to be highlighted in the center of the visualization and have its collaborators and publications animated.
Horizontal stripes intersect the screen, each of them displaying the title, venue, and publication year of a publication in which the highlighted researcher collaborated. Meanwhile, their collaborator’s names travel the screen from up to down on a falling-like animation. The peers’ names stop over the horizontal stripe with the name of a paper in which they collaborated. We use vibrant colors to highlight more recent collaborations.
Some collaborators’ names may also be connected to another name, in gray color and smaller font size, by an elastic string. This represents a second-degree collaborator with the highlighted researcher. Each gray-colored name has already collaborated with the primary name to which it is attached but has not collaborated with the highlighted author.
Visualizing Visualizers was exhibited at Beyond Borders IEEE VISAP 2019’s program in Vancouver, BC, Canada from October 22nd, 2019 to October 24nd. The visualization is publicly available in a notebook on the online reactive platform Observable.