Somnium: mapping dreams
The human memory is a precious and drake ability. We are capable to keep data, physique actions, and facts – real or not. It all depends by the level of importance or frequency (attendance) of certain information. The memory of each individual is their own responsibility, and to of a few people who care about them. From life histories to huge personal life conquests, will die with them – when the memory of the last people, that knew about it, be vanished by the time.
The interesting is that, increasingly, the individual memory not feats just in human’s brain anymore. Their existences, as their acts, histories and relationships are always being updated in the Cloud. The internet, with its social networks, storage drivers, GPS, incessant navigation data collect, became a human’s memory extension. As time passed, human’s specie may be extincted, but, with the right care, the code that shows where a person was at September, 29 of 2015, at 9:51 AM will still existing; because the smartphone GPS was turned on.
Lifelogging – data from everyday life
Behind many possibilities the lifelogging techniques offers, overtures, is the memory extension. Considering the Lifelog in data visualization, in short terms, work daily data generate by people in many human’s nature possibilities – digital or not, in the case of this project, in visualization and infographics.
In this lifelogging area, there are interesting references in names as Nicholas Feltron, Laure Frick and Christian Boltanski. Despite, they don’t claim the memory as their principal visualization subject (excepting of Boltanski, that brings in many of his artistic performances, memory as the most important discussion point),their works are presenting an almost perpetual register of their existence.
Somnium – dreams register
Somnium, as a data visualization project applied in the lifelogging technique, is a fight: memory against the time, which consumes everything.
The project idea is expand the short dream’s memorization, despite a register of recurrence and, so, their application in data visualization. Considering that the dreams are “memory composition”, they are like memory “fixers”.
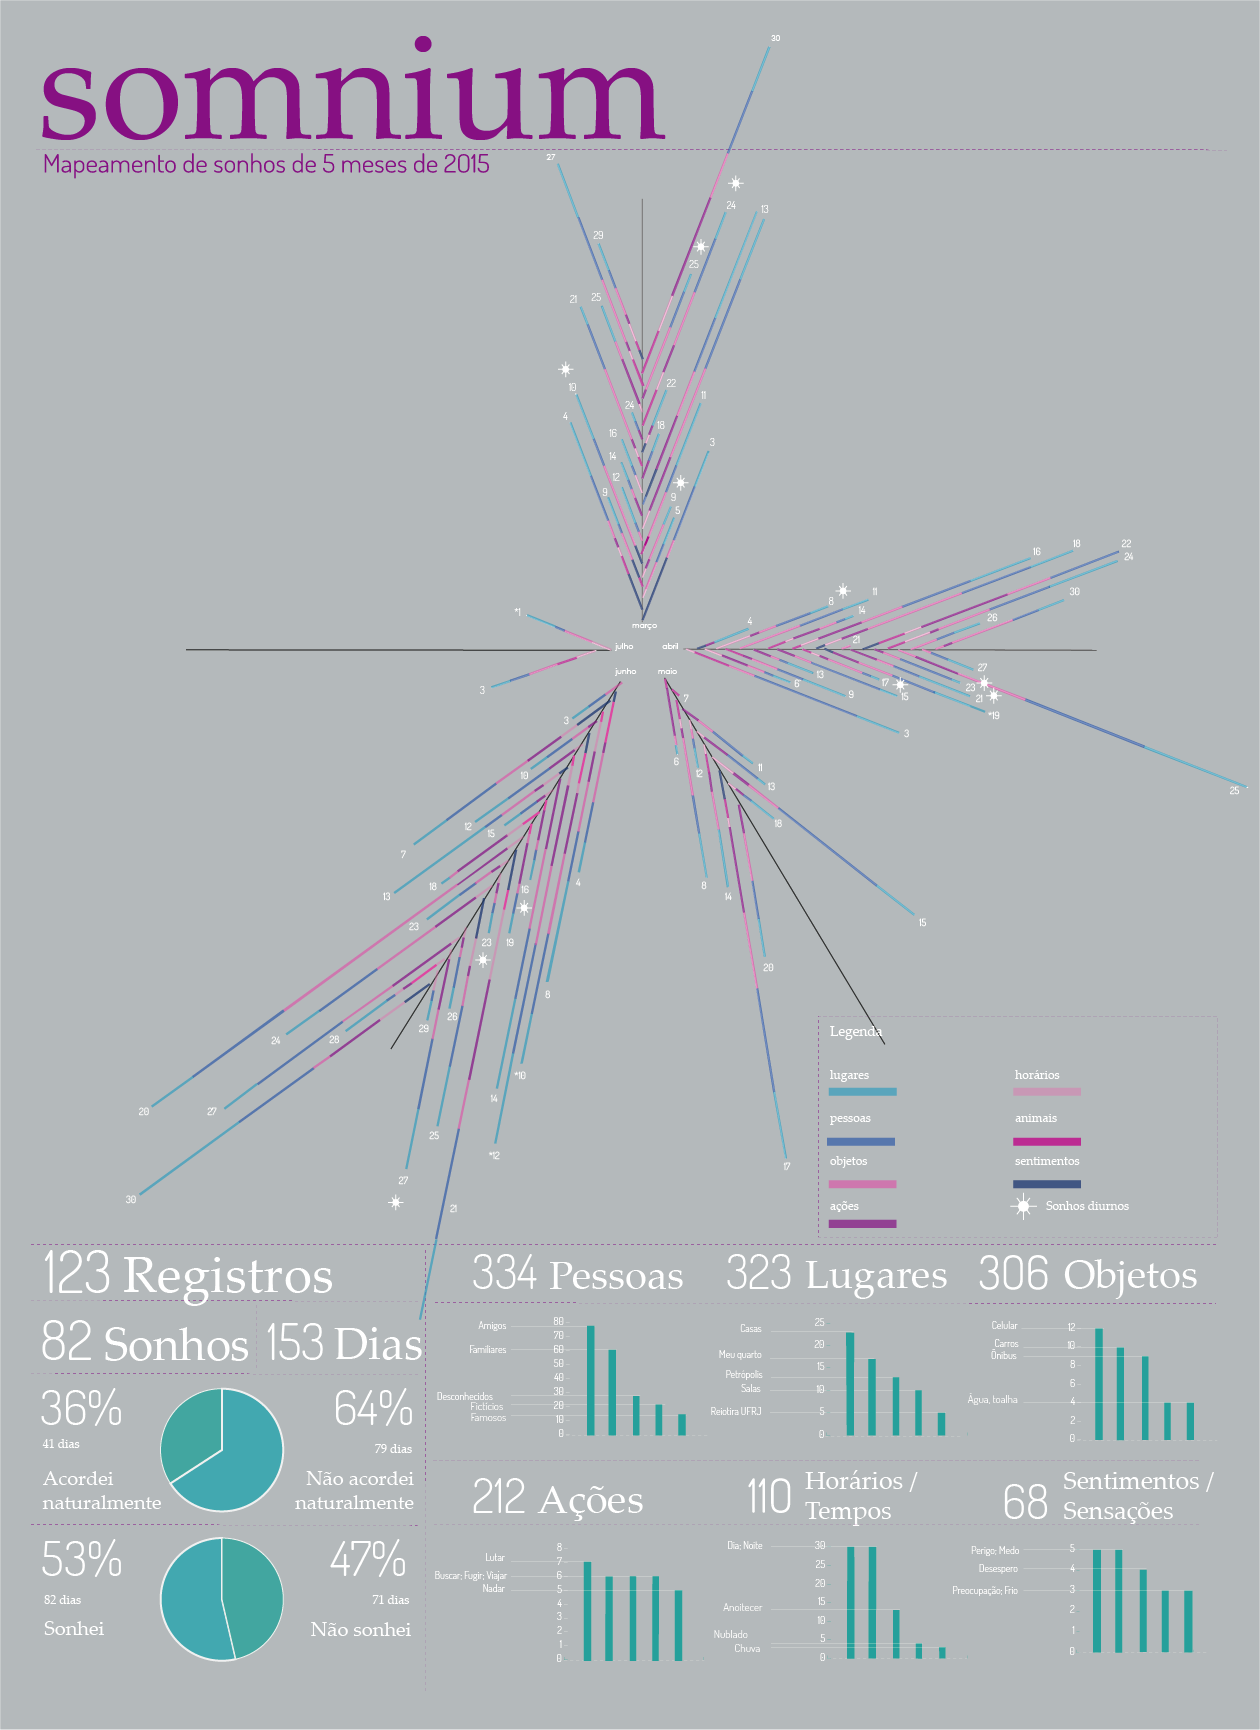
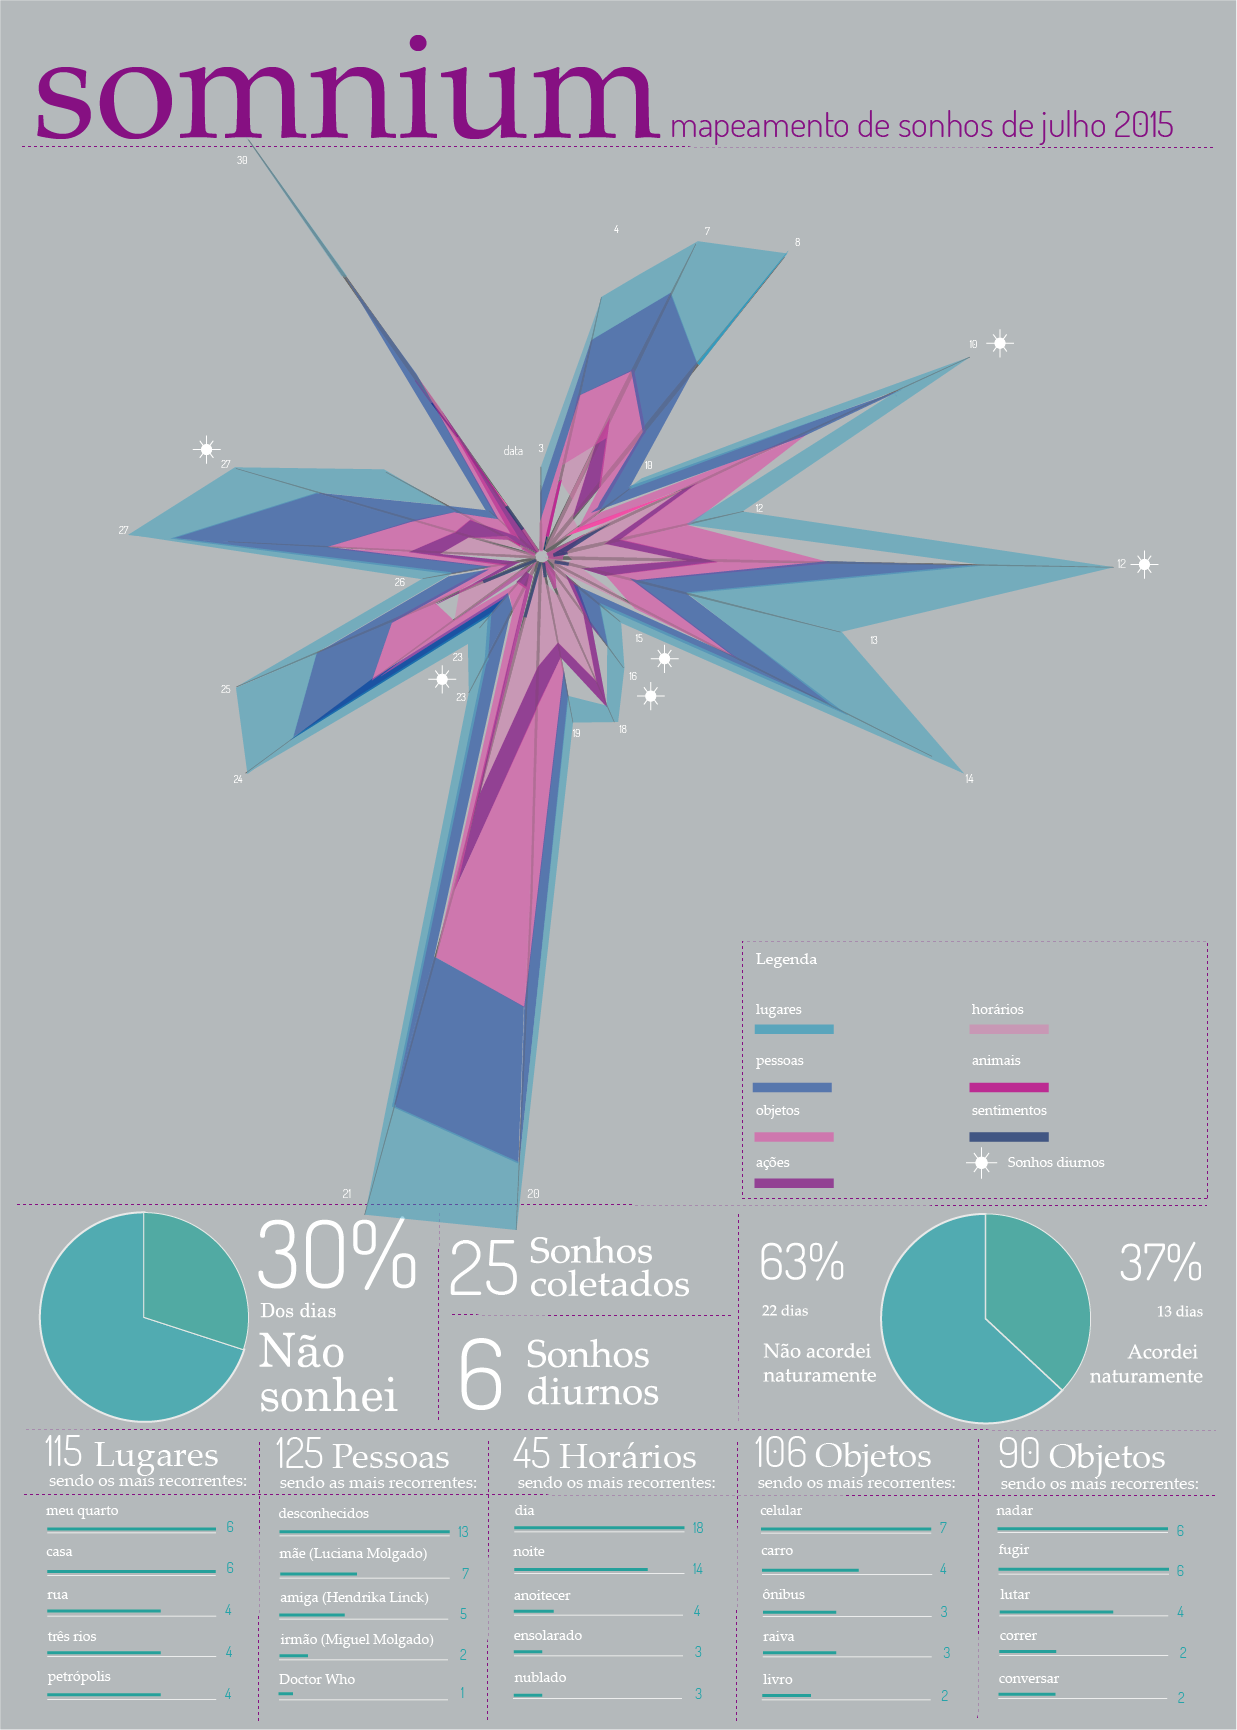
The data collection was made through the registers of key-words about (?) what was in the dream. These key-words were put in seven categories:
Places
People
Objects
Time/Day periods
Feelings/ sensations
Animals
I also considered:
- When I didn’t dream; in other words, when I didn’t remember what I dreamed.
- The days (sleep times) I wake up naturally or not; it influenced very much in my dreams.
Results
The first visual result of the project are in two posters (42x50cm). They were developed to be printed. Both visualizations bring the most recurrent item in each category.