100 years of mental diseases in Brazil
 Study the health of brazilian population is study a history of the country and its population. Furthermore, the study of the development and the treatment of diseases over the years allow us to learn its particularities, and develop new ways of treatment for this disease.
This work developed in 2013 by the design student Amanda Pereira, by the guidance of Dóris Kosminsky, created a series of visualizations with Mental Diseases as the principal theme.
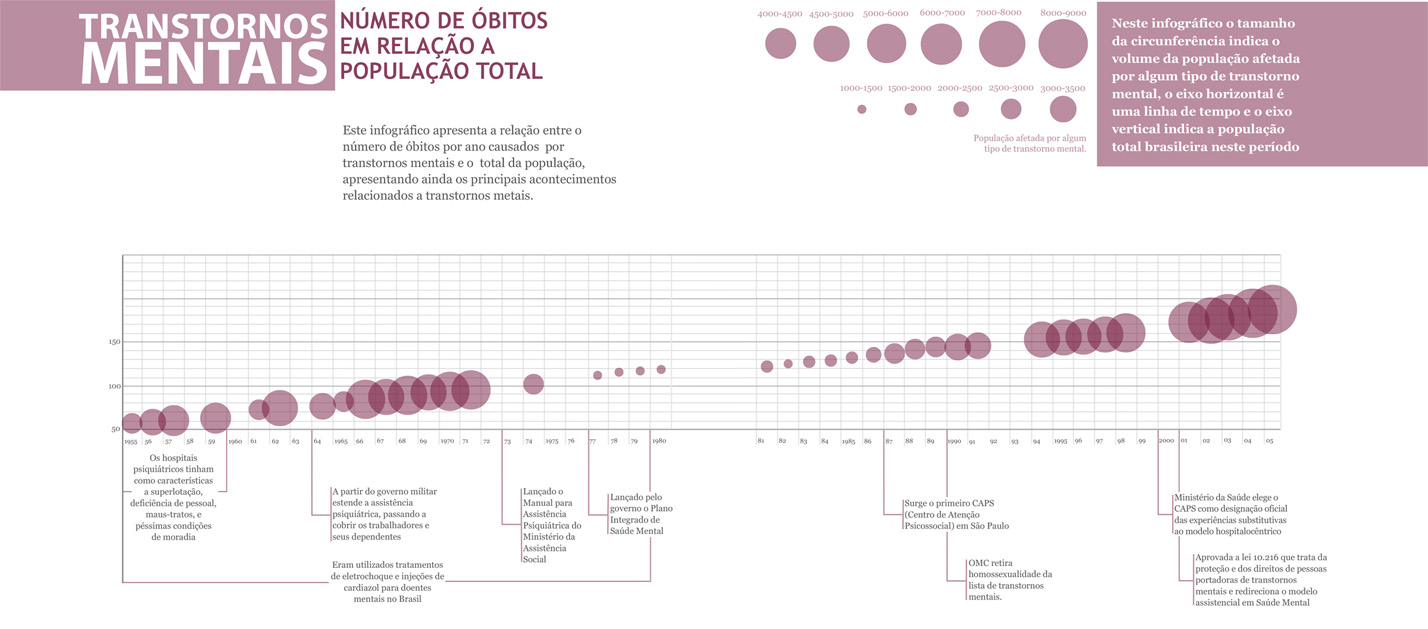
The first infographic shows a overview picture of the disease over the years. The size of the circles represents the number of citizens affected by some mental disease compared to the entire population. Furthermore, the work presents the changes occurred in the way of treatment for mental disease.
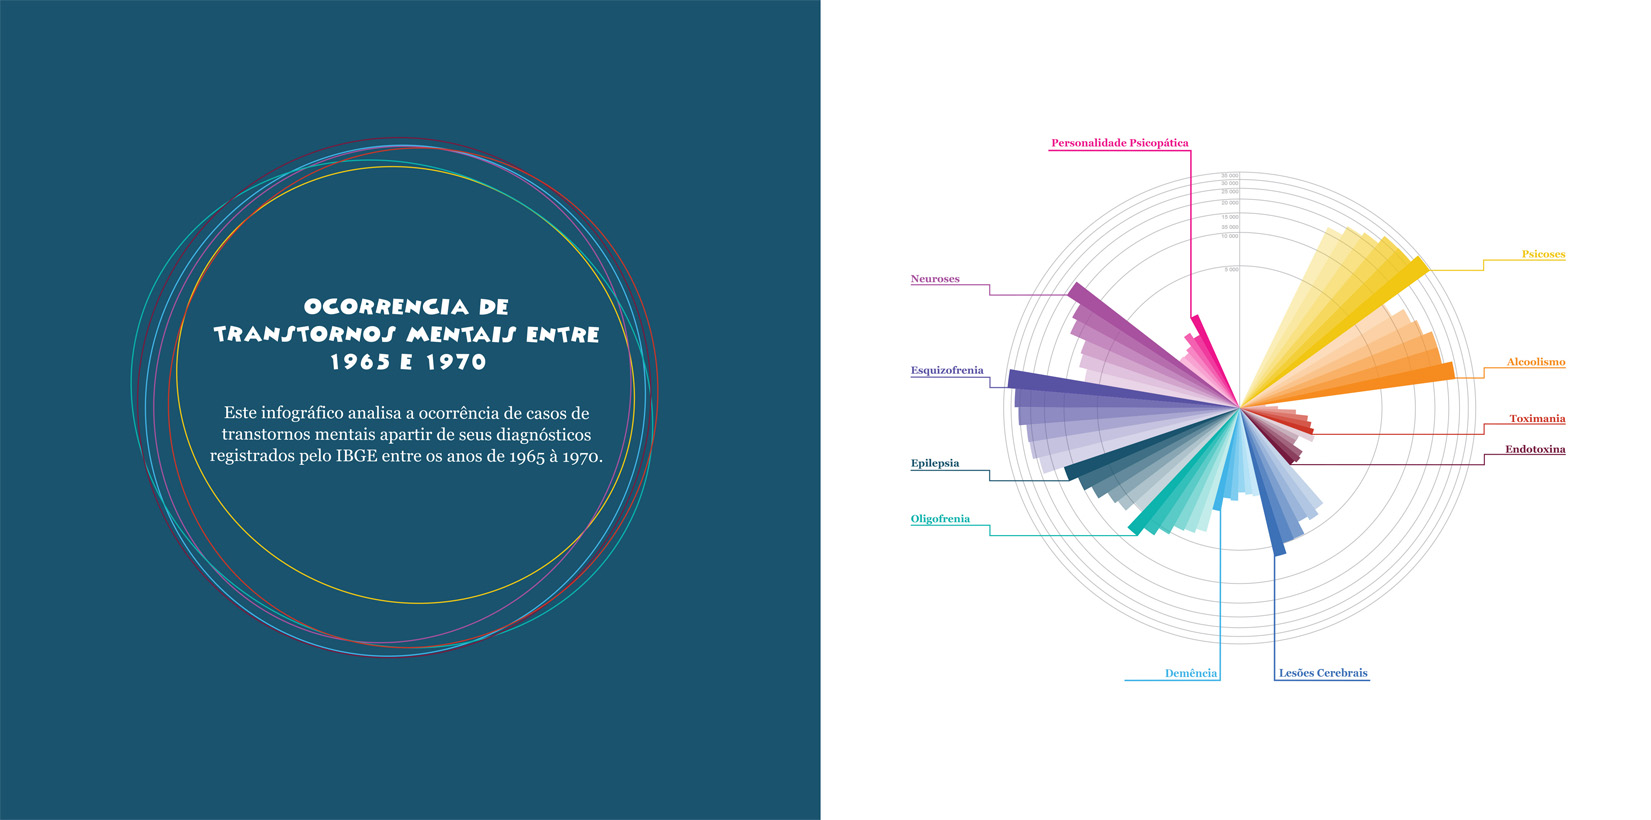
The second infographic informs the many different kinds of mental diseases, that was divided into subdivisions. The size of the type represent the number of registered cases in 1975. The third, is a comparative between the number of citizens affected by a specific kind of mental disease in a period of 5 years.
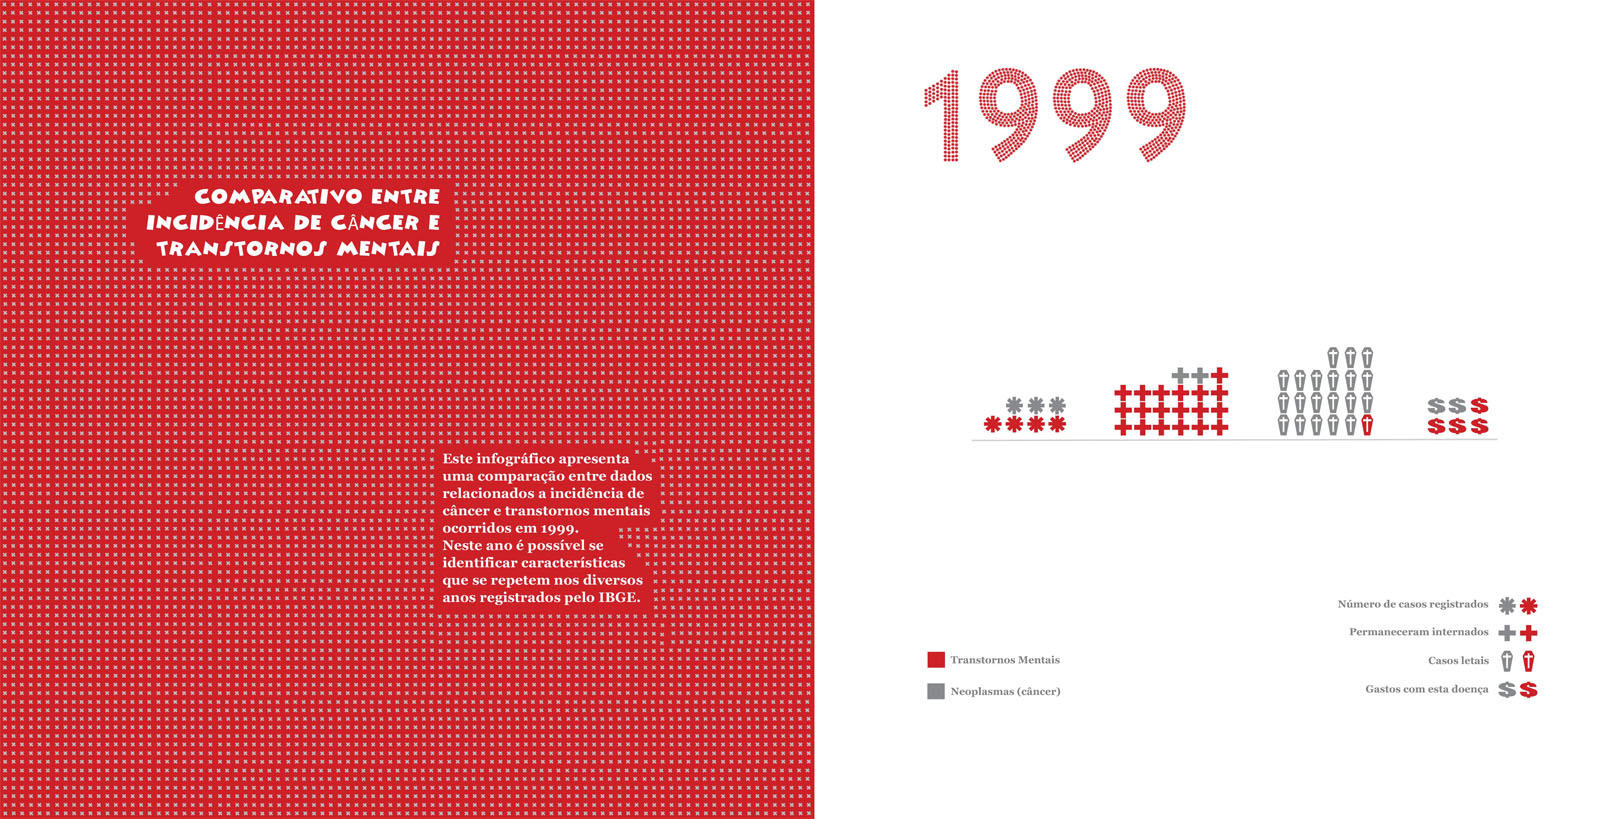
The last one is compounded in isotype style, and works as a comparative between two important kinds of disease (mental disease and cancer), comparing these two through the government spending, number of deaths and others.