Year: 2021

Fotovis: user-centered development of a tool for visually browsing photographic collections

Type: Paper
Year: 2021

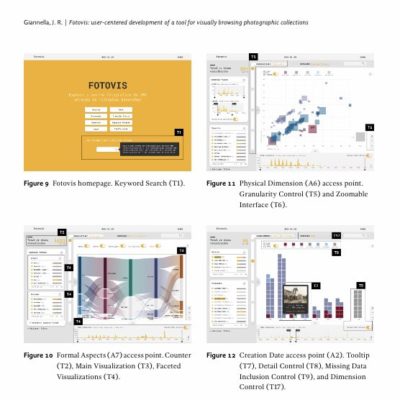
Fotovis is a tool for visualizing, exploring, and analyzing photographic collections. It is a partial result of a PhD thesis that investigated alternative, visual, and more generous browsing strategies — based on Digital Humanities — for digital tools. This paper discusses how Fotovis was conceived, developed (at the prototype level), and evaluated (at the interface level), through a user-centered approach and using a sample of photographs from the Moreira Salles Institute, an important Brazilian cultural entity. The goal is to highlight the definition of the users of Fotovis, and the design decisions that meet their exploratory and analytical needs.

Article published in Infodesign (Volume 18, Issue 3, dez. 2021)
Authors:

Júlia Rabetti Giannella

Animation and data visualization: an analysis protocol proposal

Type: Paper
Year: 2021
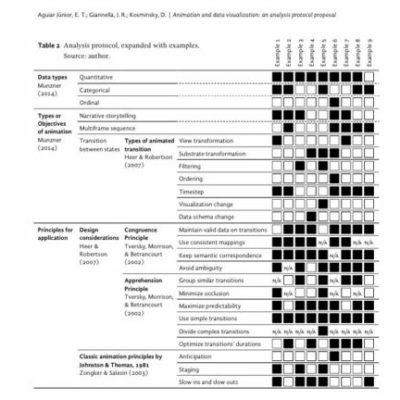
Animation can have a range of purposes when applied to data visualization. It can be used to enhance a chart’s readability, make it more appealing, or aid the narrative storytelling. The objective of this paper is to understand the different ways researchers have found to describe the use of animation as a tool for data visualization, and how these approaches interact with one another. Thus, an analysis protocol was established — based on definitions by Munzner, Heer & Robertson, Schwabish, and other researchers in the field — and it was applied to real examples in order to test its ability to identify and categorize types of animation and their uses. It is expected that this analysis protocol could be used as a resource for data visualization professionals and enthusiasts, students, and other interested parties who could benefit from a deeper examination of the theme.
Article published in Infodesign (Volume 18, Issue 3, dez. 2021)
Authors:

Elson Teixeira; Júlia Rabetti Giannella; Doris Kosminsky

Slave Voyages: Reflections on Data Sculptures

Type: Paper
Year: 2021
This pictorial presents the development of a data sculpture, followed by reflections inspired by Research through Design (RtD) and Dahlstedt’s process-based model of artistic creativity. We use the notion of negotiation between concept and material representation to reflect on the ideation, design process, production, and the exhibition of “Slave Voyages” – a set of data sculptures that depicts slave traffic from Africa to the American continent. The work was initially produced as an assignment on physicalization for the Design course at the Federal University of Rio de Janeiro. Our aim is to open discussion on material representation and negotiation in the creative process of data physicalization.
Article published in IEEE Computer Graphics and Applications (Volume: 41, Issue: 1, Jan.-Feb. 2021)
Authors:

Doris Kosminsky, Douglas Thomaz de Oliveira

Belief at first sight Data visualization and the rationalization of seeing

Type: Paper
Year: 2020

The theme for this paper emerged from a 3-year project on visualizing open government data at the University of Calgary. During that time, we had many fruitful conversations over the implications of visualizing data for the public, and the implied trust in the data that this would or would not bring. This paper is a result of some of these conversations and you can download it here.

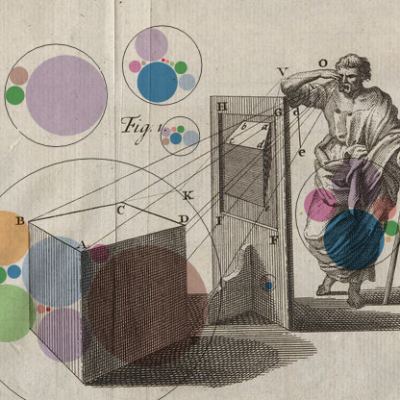
Abstract: Data visualizations are often represented in public discourse as objective proof of facts. However, a visualization is only a single translation of reality, just like any other media, representation devices, or modes of representation. If we wish to encourage thoughtful, informed, and literate consumption of data visualizations, it is crucial that we consider why they are often presented and interpreted as objective. We reflect theoretically on data visualization as a system of representation historically anchored in science, rationalism, and notions of objectivity. It establishes itself within a lineage of conventions for visual representations which extends from the Renaissance to the present and includes perspective drawing, photography, cinema and television, as well as computer graphics. By examining our tendency to see credibility in data visualizations and grounding that predisposition in a historical context, we hope to encourage more critical and nuanced production and interpretation of data visualizations in the public discourse.

Presentation at Information+ Conference:

Authors:

Doris Kosminsky, Jagoda Walny, Jo Vermeulen, Søren Knudsen, Wesley Willett, & Sheelagh Carpendale
Ano da publicação