Everyday in Data
We live in a connected world and increasingly produce data about our daily life, sometimes without realizing it.
Under Dr. Doris Kosminsky supervision (in 2013.1), many visualizations were produced. See below:
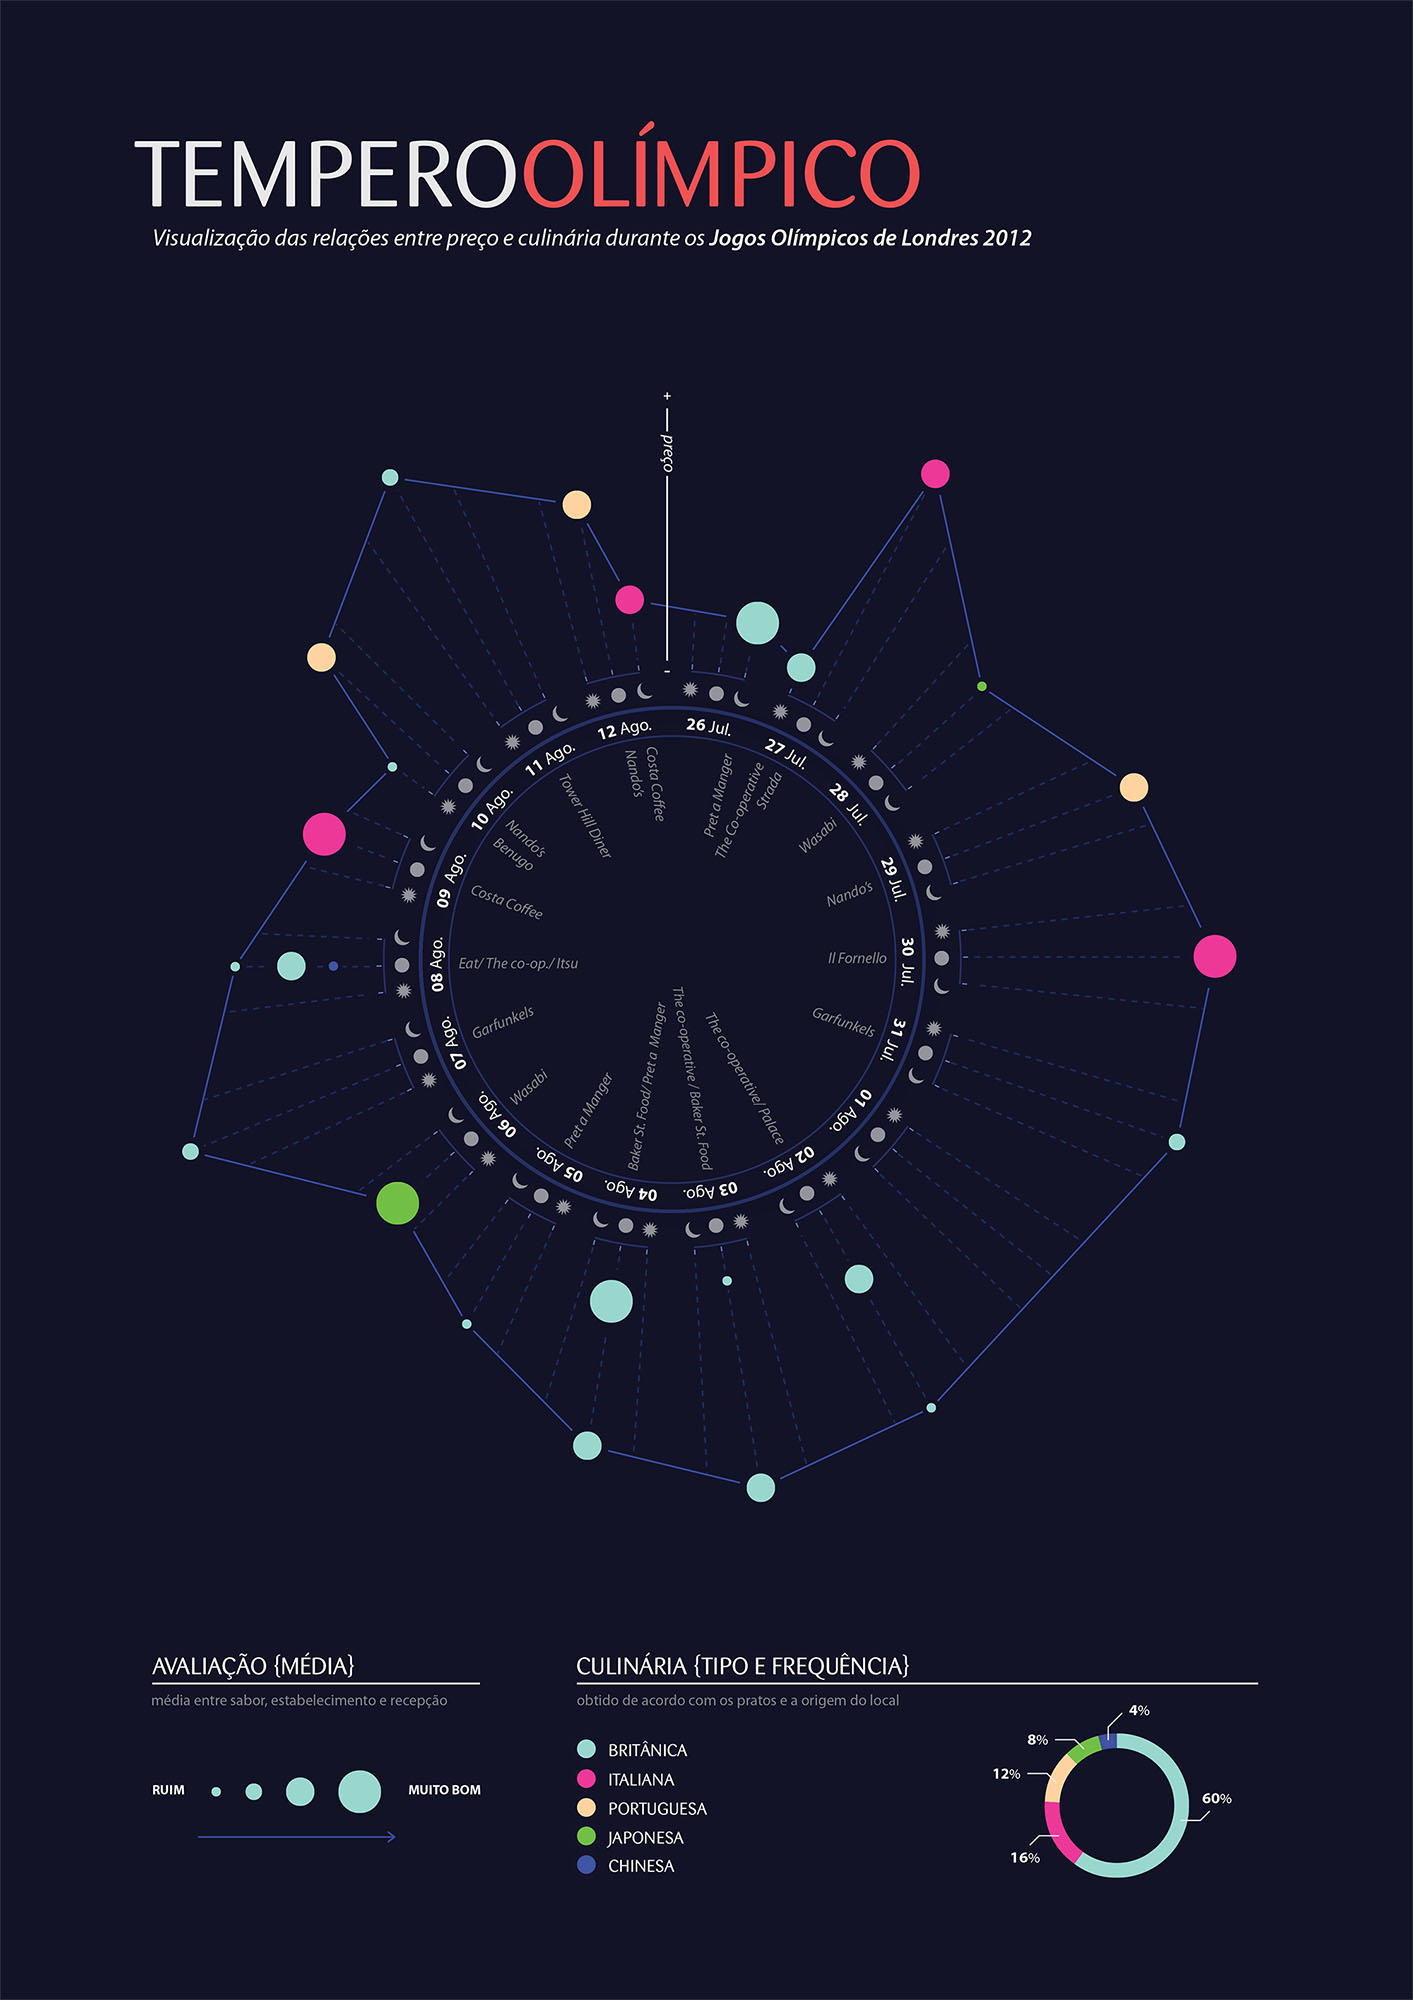
Aline Aride (1. Tempero Olímpico) presented information about every meal she had in a visit to London to attend the Olympics: day, time, restaurant name, cuisine and its own avaliation.
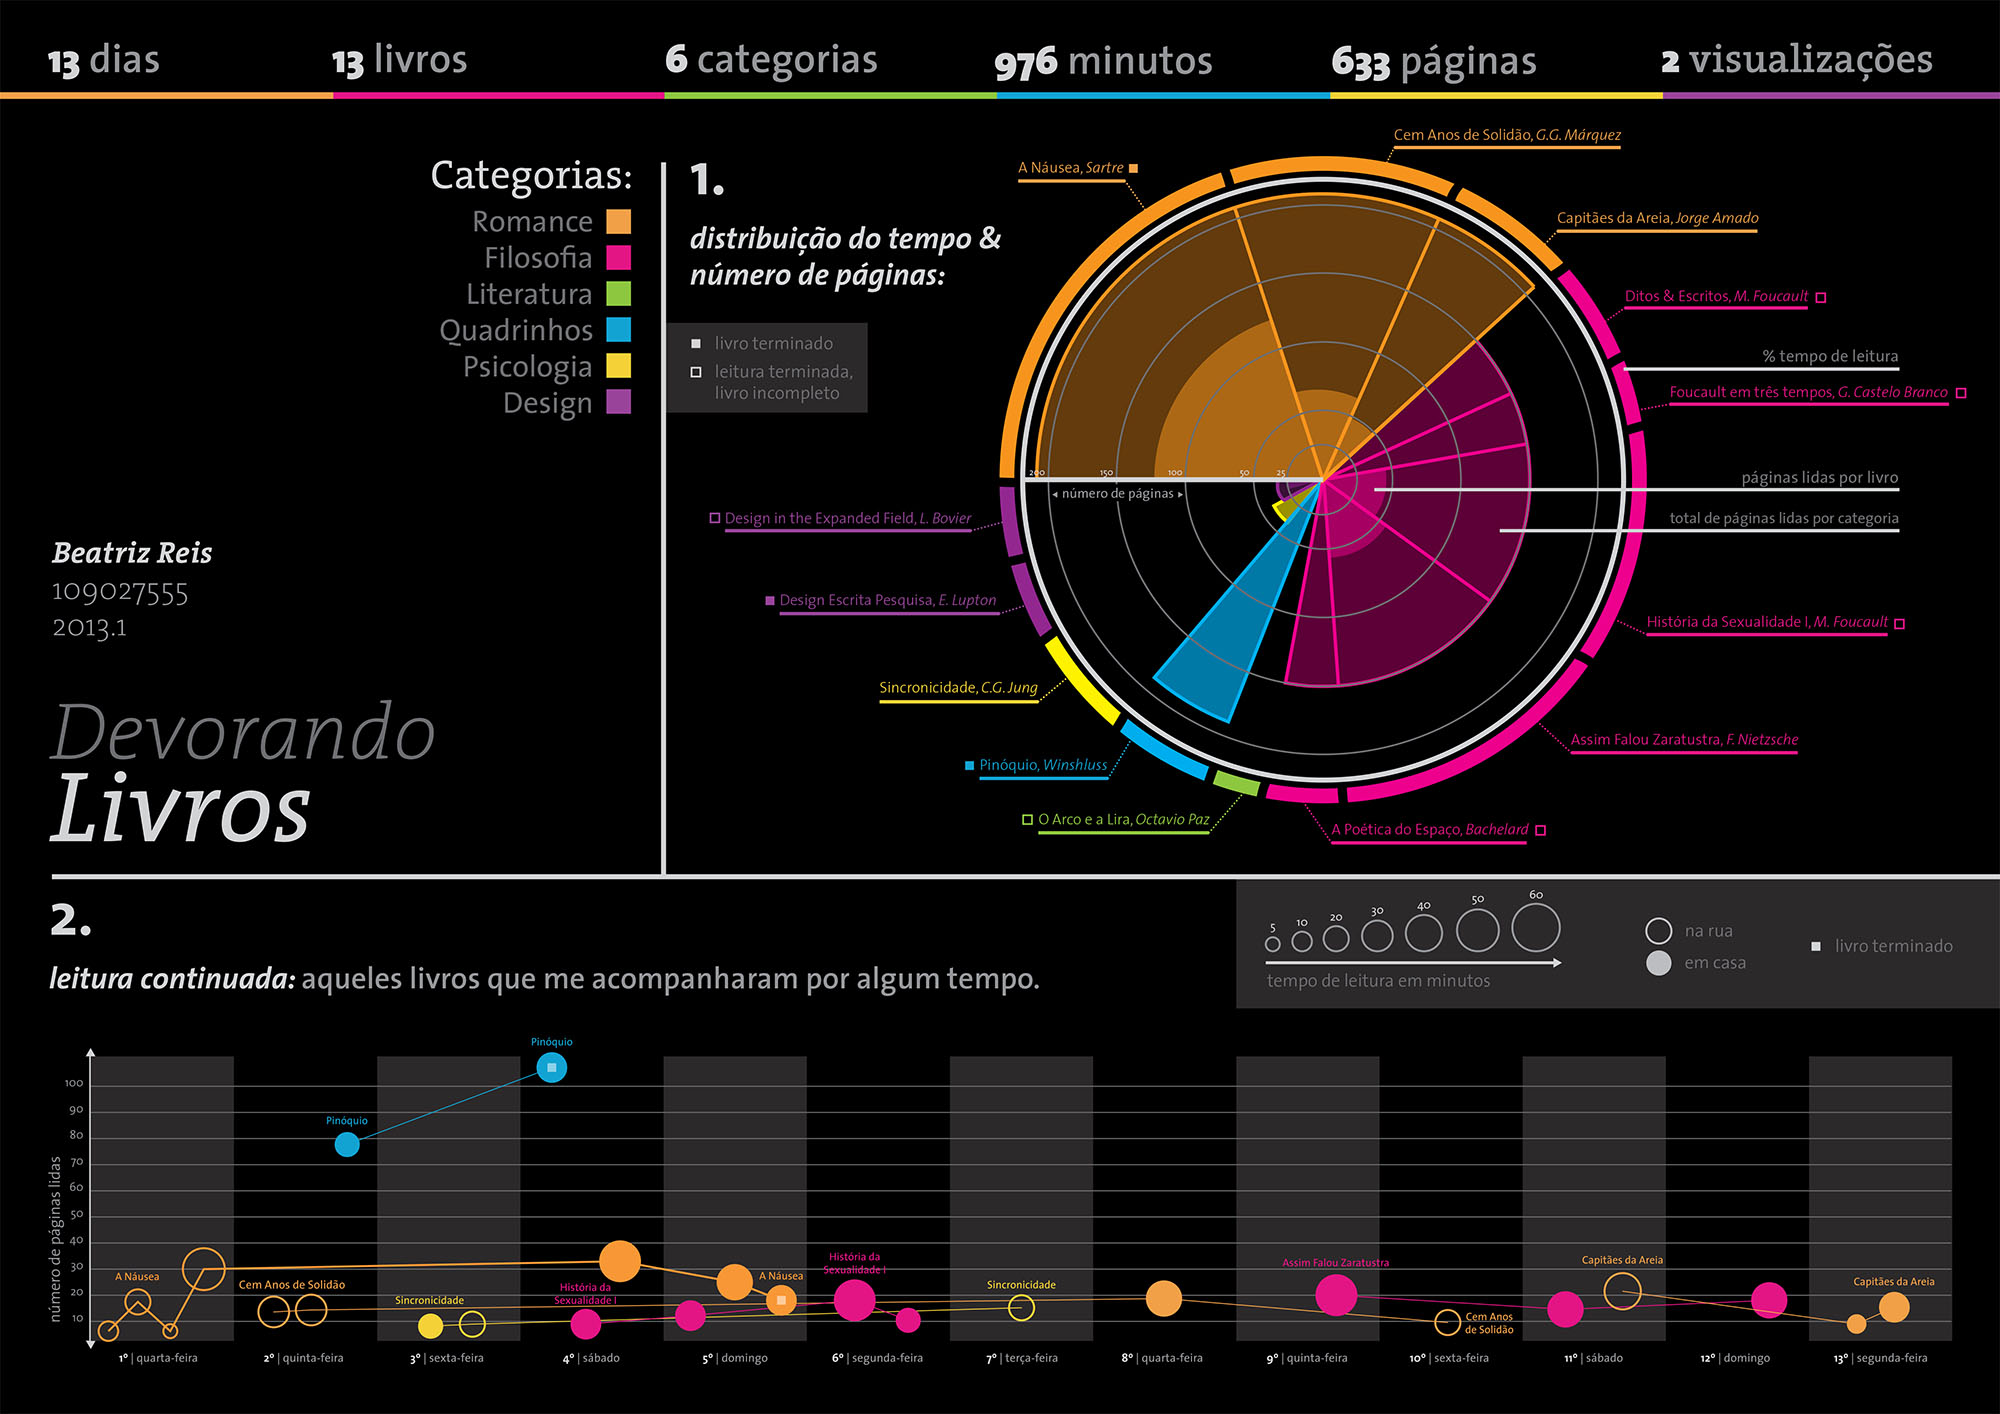
Beatriz Reais (2. Devorando livros) reads many books simultaneously. She has created an infographic that lists the genres , number of pages read, the place of reading and the time she read each book.
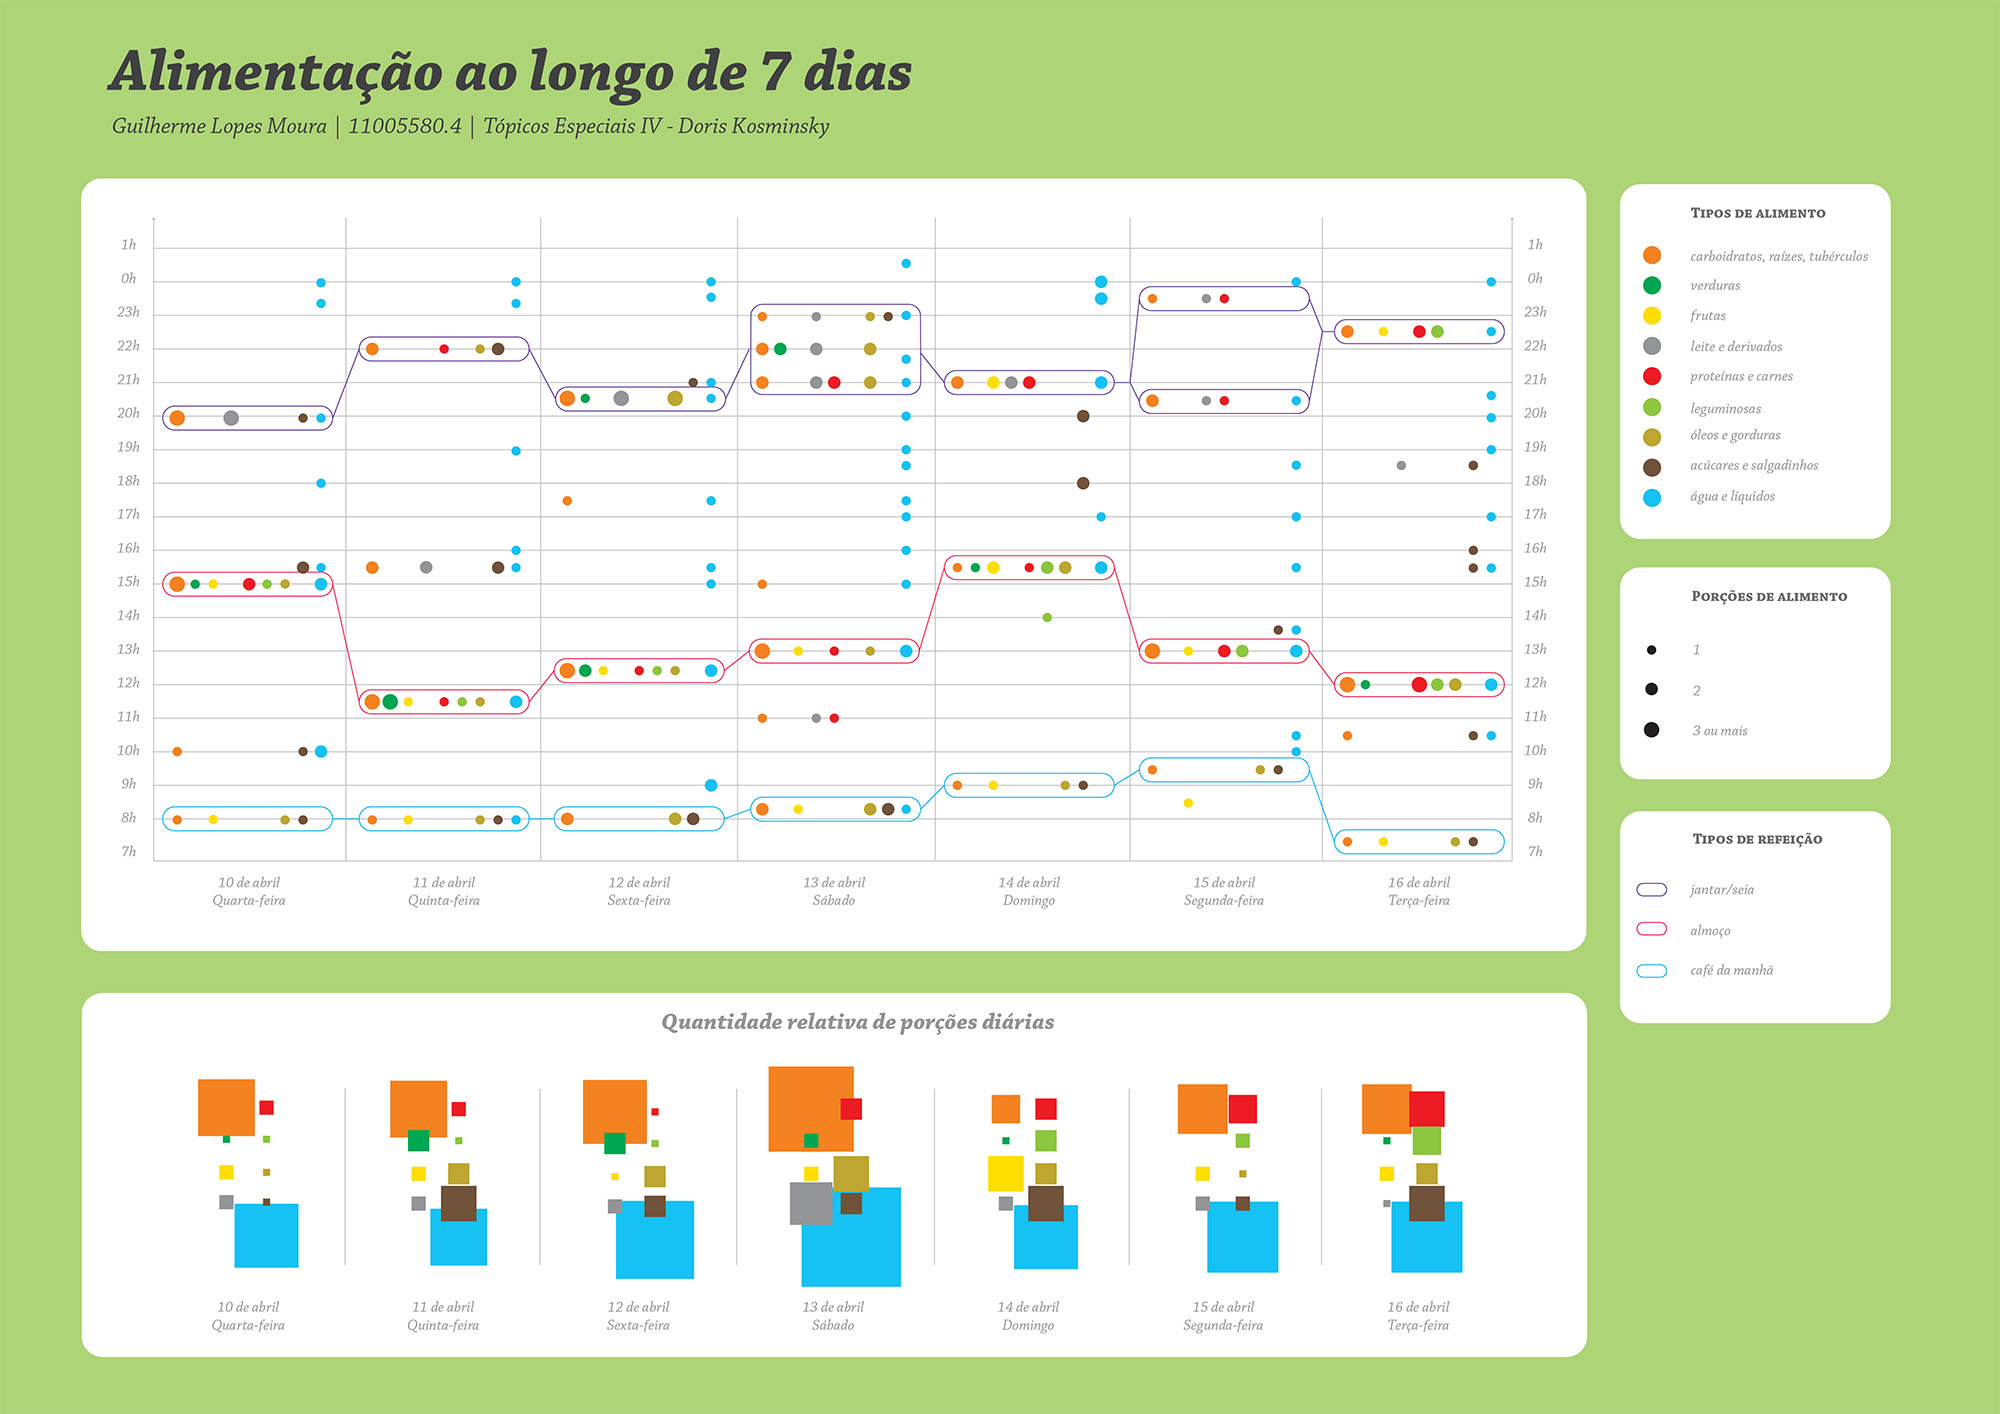
Guilherme Lopes Moura (3. Alimentação ao longo de 7 dias) presented an infographic related to the type of food, number and size of servings, time and type of meal.
Guilherme Marques (4. Camisas e suas cores) presented the t-shirts he used in a month: colors, places visited and weather in the period.
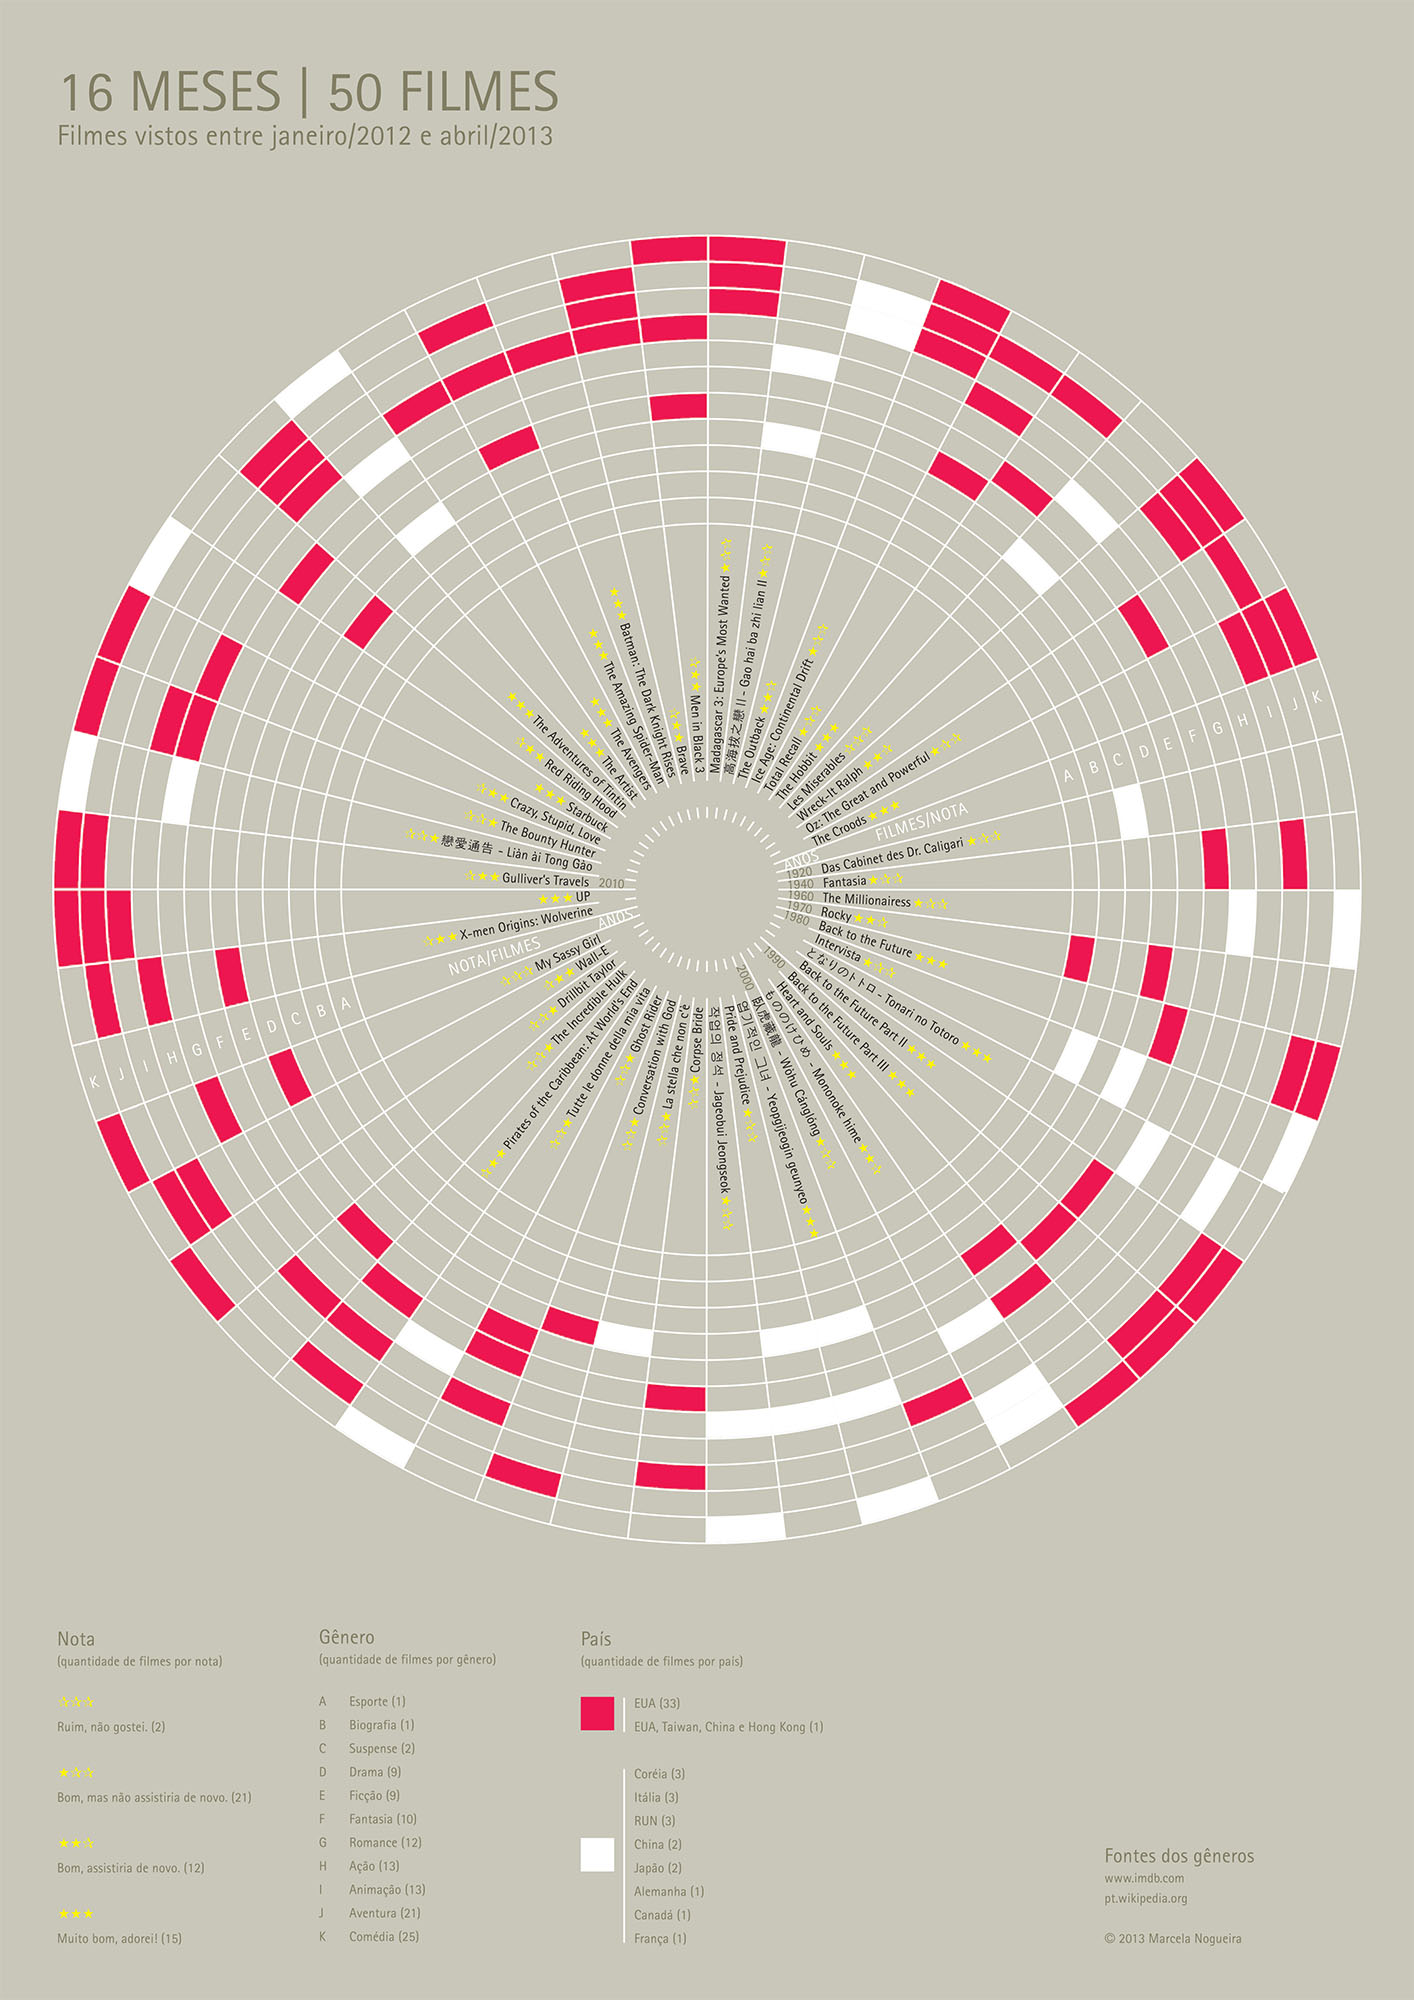
Marcela Nogueira (5. 16 meses, 50 filmes) created an infographic about 50 movies watched over 16 months, relating information about the film genre, country and her opinion about each one.